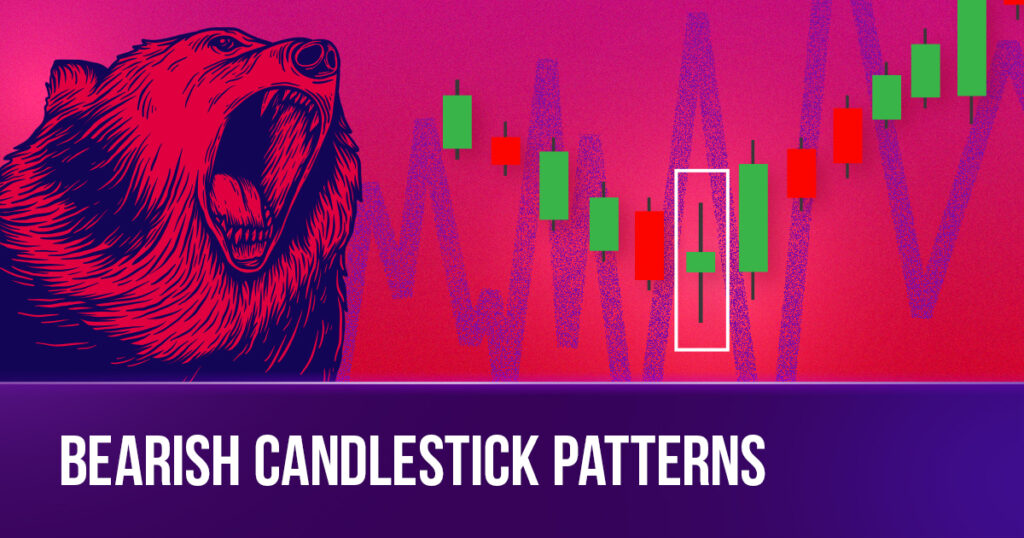
Understanding the ebb and flow of market sentiment is crucial. Bulls and bears, the timeless symbols of market optimism and pessimism. In this blog post, we’re turning our attention to the bearish side, delving into the 14 significant bearish candlestick patterns in deciphering market movements.
1. Bearish Marubozu
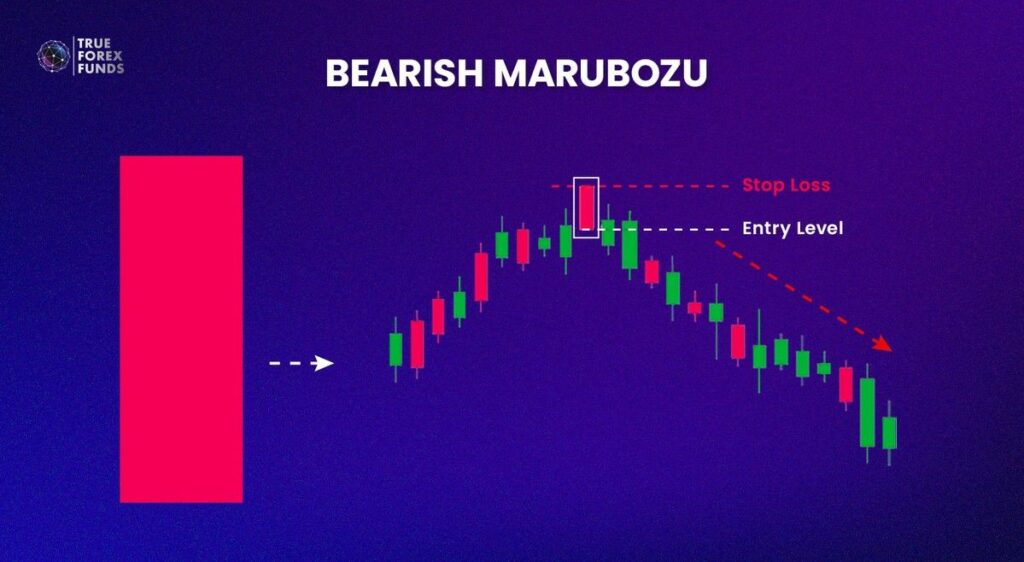
In Japanese, the term “Marubo” refers to a substantial block or form. A Bearish Marubozu, depicted by a descending red candle, exhibits a sizable body with minimal shadows. Its opening and closing prices nearly coincide with either the highest or lowest prices of the trading session. The presence of a Bearish Marubozu candlestick signifies the dominance of sellers, indicating a more definitive downward movement in prices.
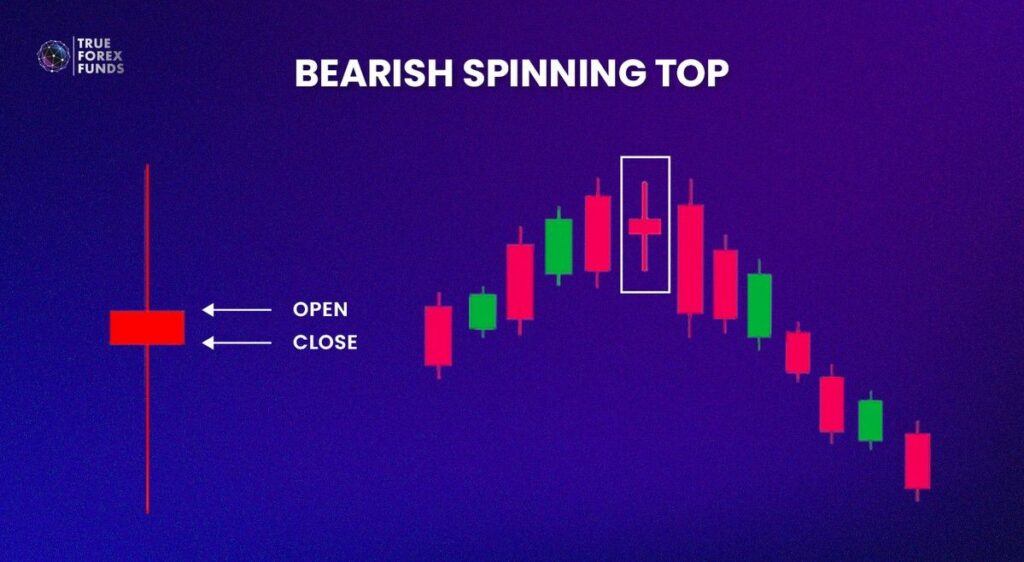
2. Bearish Spinning Top
A Bearish Spinning Top is a single red candlestick pattern characterized by a small body and extended shadows, located in the peaks of an uptrend. This pattern hints at the potential for a reversal in an ongoing downtrend, indicating a delicate equilibrium between buyers and sellers. The long shadows highlight notable price volatility during the trading session, while the proximity of opening and closing prices suggests a balanced market sentiment.
3. Bearish Doji
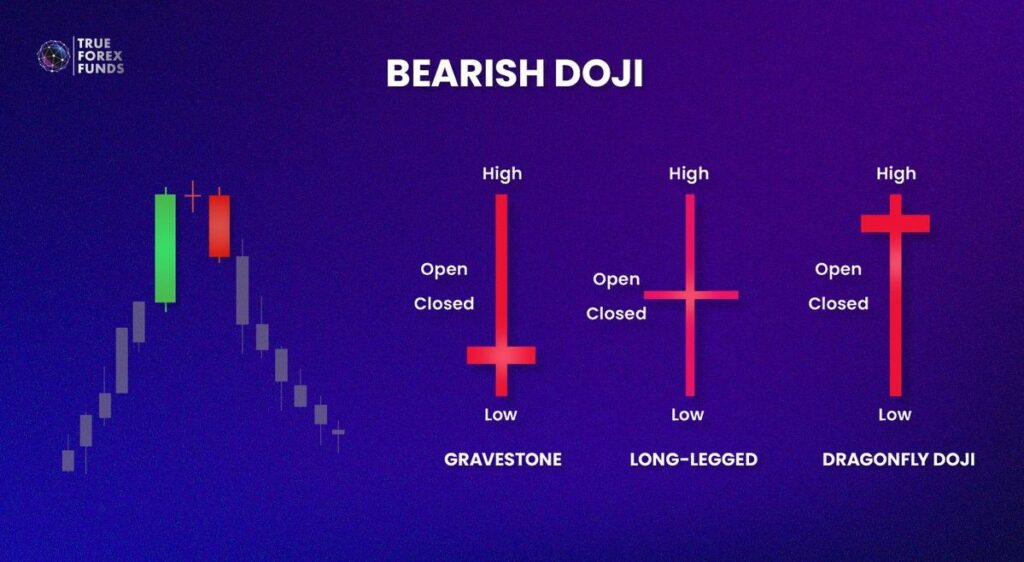
A Bearish Doji is a red single candlestick pattern where the opening and closing prices are nearly identical, resulting in a small body accompanied by long upper and lower shadows. When a Doji appears on a chart, it suggests that the security under consideration lacks a distinct established direction. This pattern signifies a state of indecision or uncertainty among market participants regarding future prices. There are three types of Bearish Doji candlestick patterns depending on the opening and closing prices.
4. Hanging Man
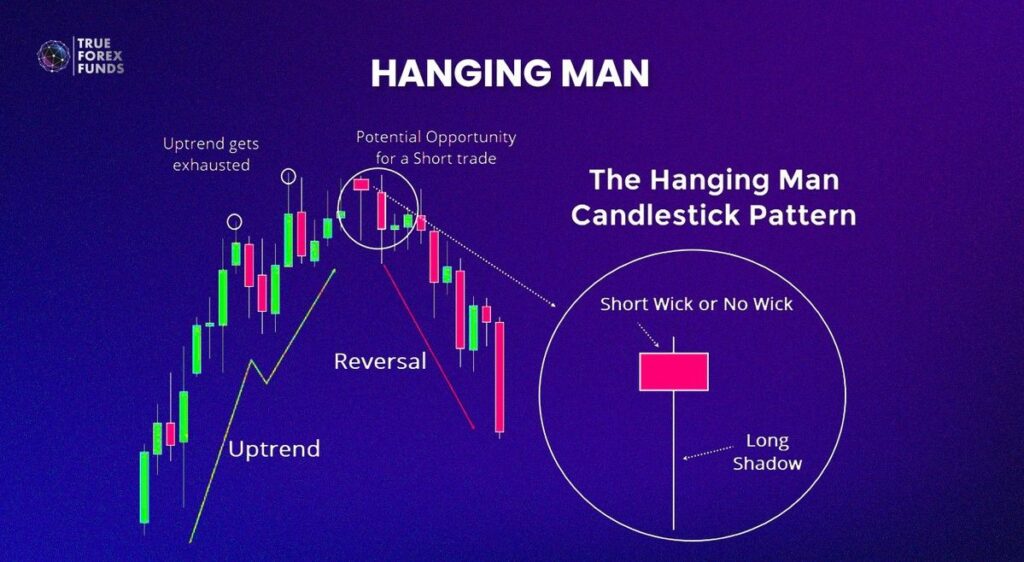
A Hanging Man is a single candlestick pattern that emerges at the peaks of uptrends. It is characterized by a lower shadow that is at least twice as long as its body, and the upper shadow may be either nonexistent or very short. This pattern can indicate that the market has reached the pinnacle of an uptrend and is likely to shift downwards. In the case of a Green Hanging Man, where the closing price equals the highest price, it suggests a slight price decline. Conversely, a Red Hanging Man, where the opening price equals the highest price, signals a potential sharp drop in prices.
5. Shooting Star
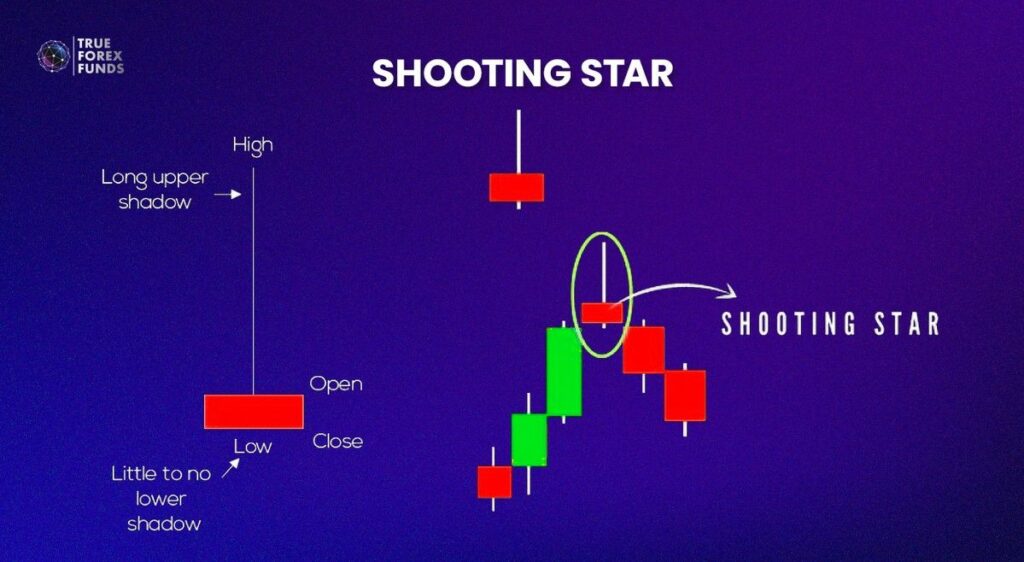
A Shooting Star is a single candlestick pattern recognized by upper shadows that are at least twice as long as its body, with very short or nonexistent lower shadows. The significance of the shooting star’s larger wick suggests a stronger reversal pattern compared to the hanging man. As a buy-side rejection pattern, it indicates a weakening of buying power and a shift in control to sellers.
6. Bearish Engulfing Pattern
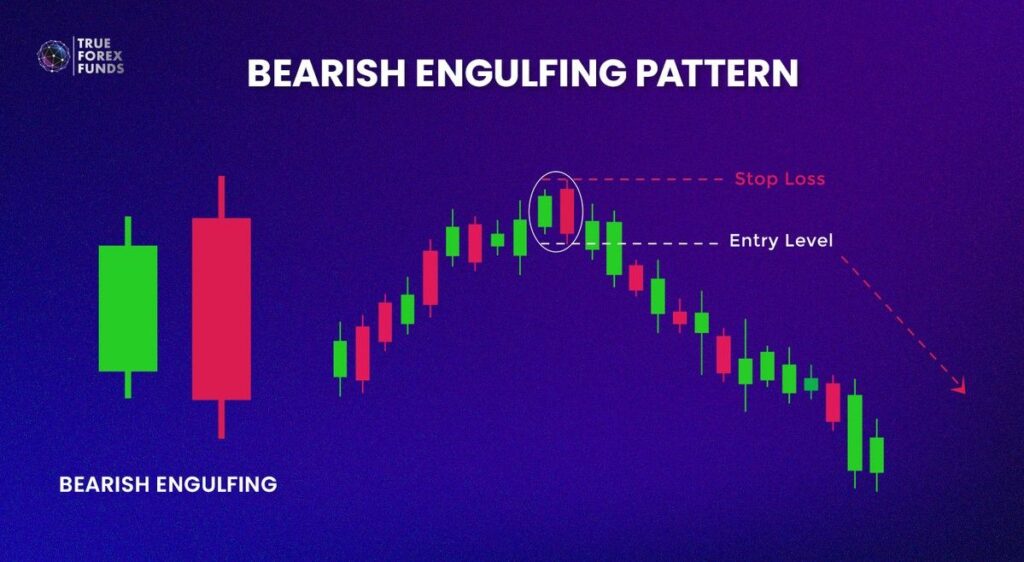
The Bearish Engulfing pattern involves a smaller bullish candle followed by a larger bearish candle that completely engulfs the preceding one. This pattern indicates a potential shift from a bullish to a bearish trend. The presence of a bearish engulfing pattern signals that sellers are gaining control, suggesting the likelihood of a developing bearish trend in the market.
7. Tweezer Top
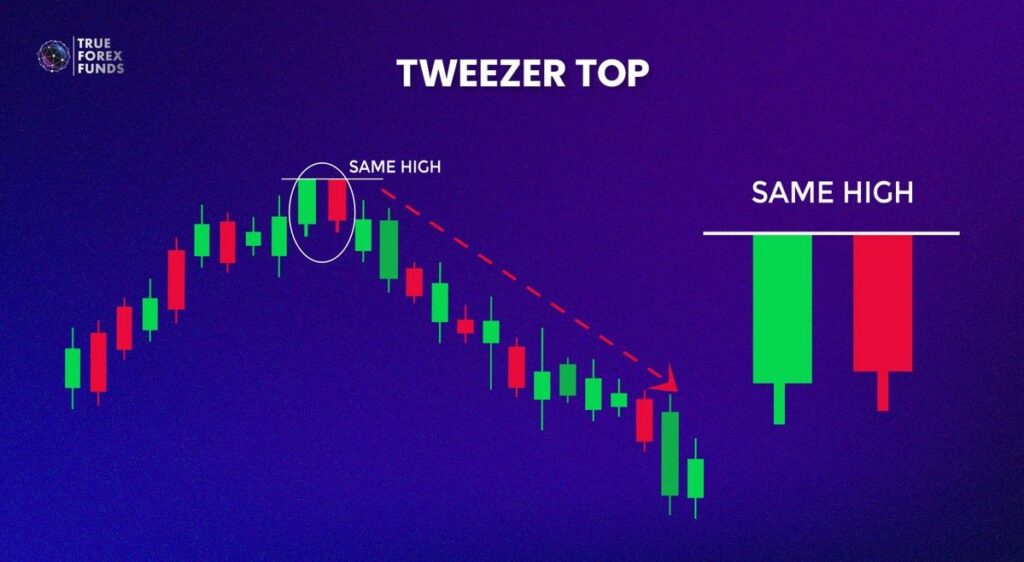
A Tweezer Top happens when two candles have almost the same highest point. This shows there might be a struggle between buyers and sellers, leading to potential resistance and a shift from a bullish to a bearish trend. Sellers are trying to stop prices from going higher, and buyers are also fighting to hold their ground, creating a resistance level over two sessions.
8. Bearish Harami
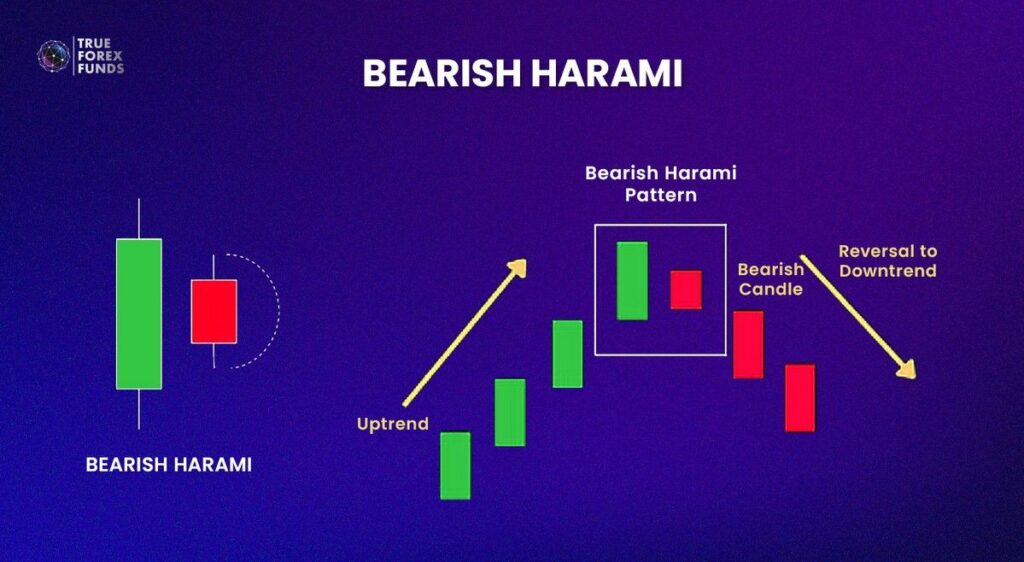
The bearish harami is formed when a big bullish candle is followed by a smaller bearish candle that is entirely within the previous candle. This pattern suggests a potential weakening of an upward trend and the chance of a shift toward a downward trend. In this situation, when buyers are dominant, and then selling pressure comes in, there’s a conflict between both sides, with sellers aiming to take control of the market.
9. Dark Cloud Cover
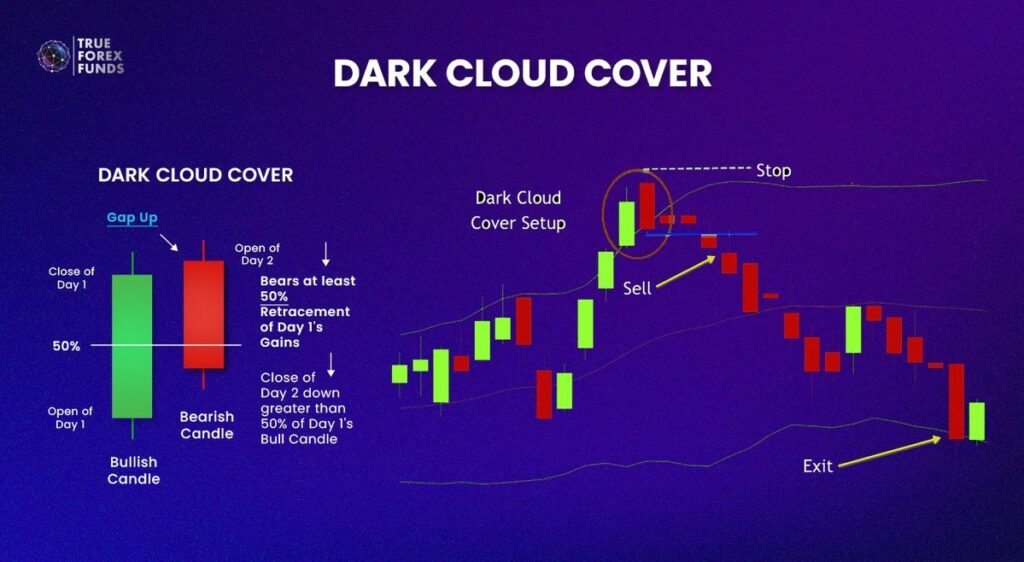
The dark cloud cover begins with a positive (bullish) candle, succeeded by a negative (bearish) candle that opens above the prior candle’s close and ends below its middle point. This pattern suggests that following a robust bullish trend, the bears could take charge. In an upward trend with robust buying, when selling pressure intensifies, it indicates a shift favoring the sellers.
10. Evening Star
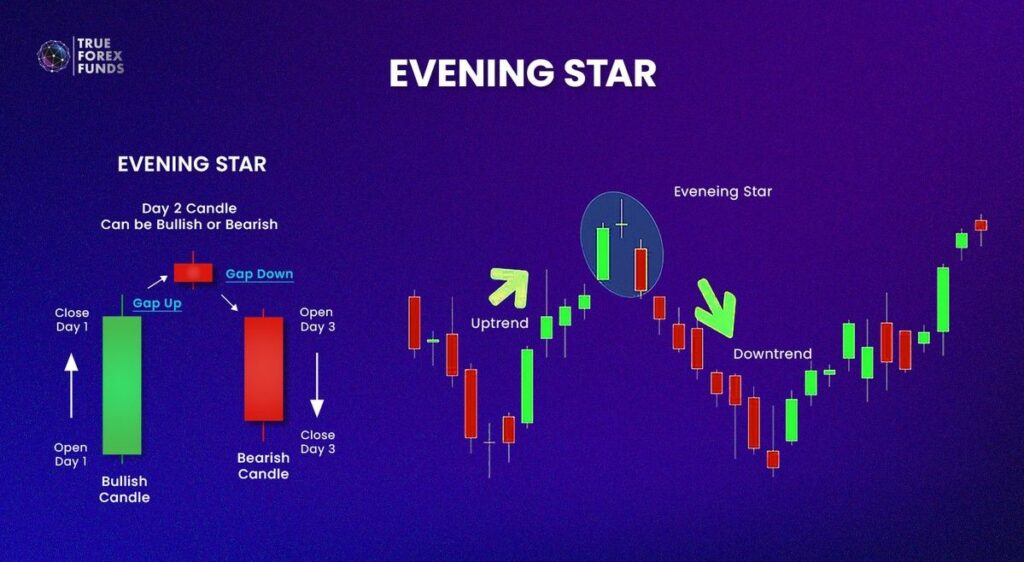
The Evening Star pattern is often seen during bullish trends and unfolds in three stages. It starts with a large bullish candle, indicating a prevailing uptrend. Following this, a small bearish candle appears, intentionally avoiding the body of the initial strong bullish candle, revealing market indecision. The pattern concludes with a substantial bearish candle, emphasizing that its body should not overlap with the small second candle but should significantly penetrate the body of the first bullish candle, commonly ranging from 2/3 to 3/4 of its lower end. This sequence suggests a potential shift towards a bearish reversal trend in the market.
11. Three Black Crows
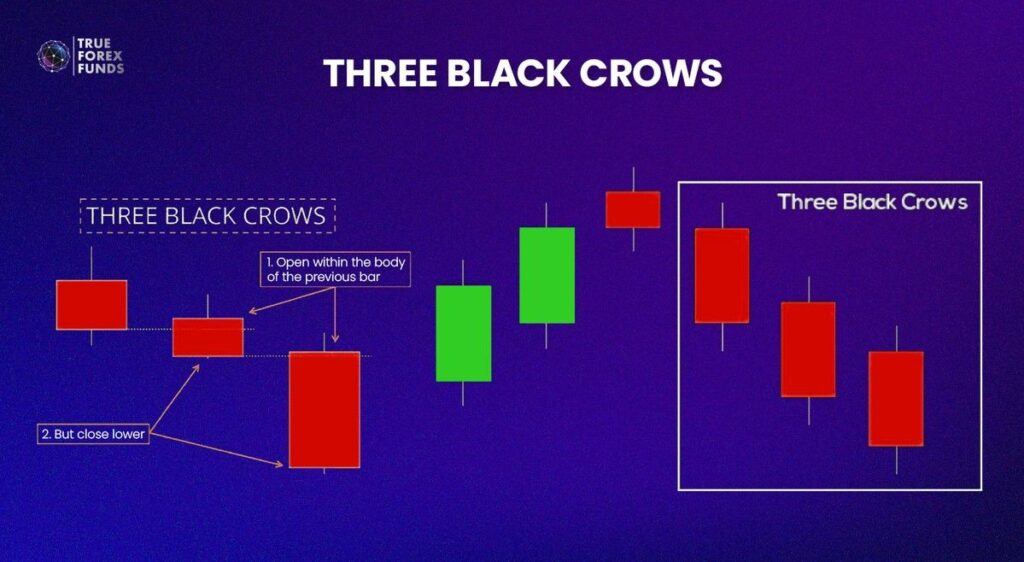
This pattern consists of three consecutive downward (bearish) candles, often referred to as “Three Black Crows.” The first candle acts as a reversal signal, initiating the pattern and indicating a potential end to an upward trend or a consolidation phase. The second candle is typically larger than the previous one, closing near its low without a significantly lower wick. The third candle is often at least the same size as the second, featuring a small or no shadow.
This confirms a sustained bearish momentum. Three Black Crows, commonly observed in an uptrend, signal a sharp reversal to the downside. Notably, the pattern becomes more reliable when the body of the first candle is positioned above the low of the preceding black candle.
12. Three Inside Down
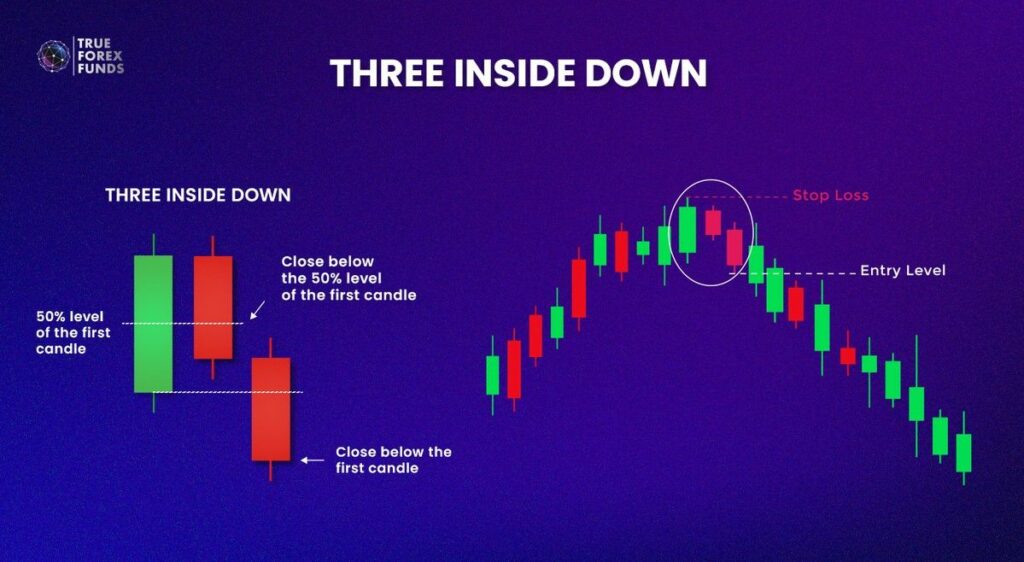
Three Inside Down patterns are reversal signals, typically identified at the conclusion of an uptrend. The initial candle, positioned at the uptrend’s peak, is characterized by an elongated bullish candlestick. The second candle is bearish, often descending to at least the midpoint of the first candle. Subsequently, the third candle is also bearish and must close below the low of the first candle. This sequence implies that the existing trend may be concluding, and a new reversal trend is likely beginning.
13. Downside Tasuki Gap
The Downside Tasuki Gap, a three-bar candlestick pattern, serves as a reliable indicator of persistent downward momentum. In this pattern, the first red candlestick emerges within an existing downtrend, followed by a second red candlestick with a gap below the close of the previous bar, extending the downward trajectory. The sequence concludes with a green candlestick closing within the gap formed by the initial two bars, suggesting a potential shift in market sentiment.
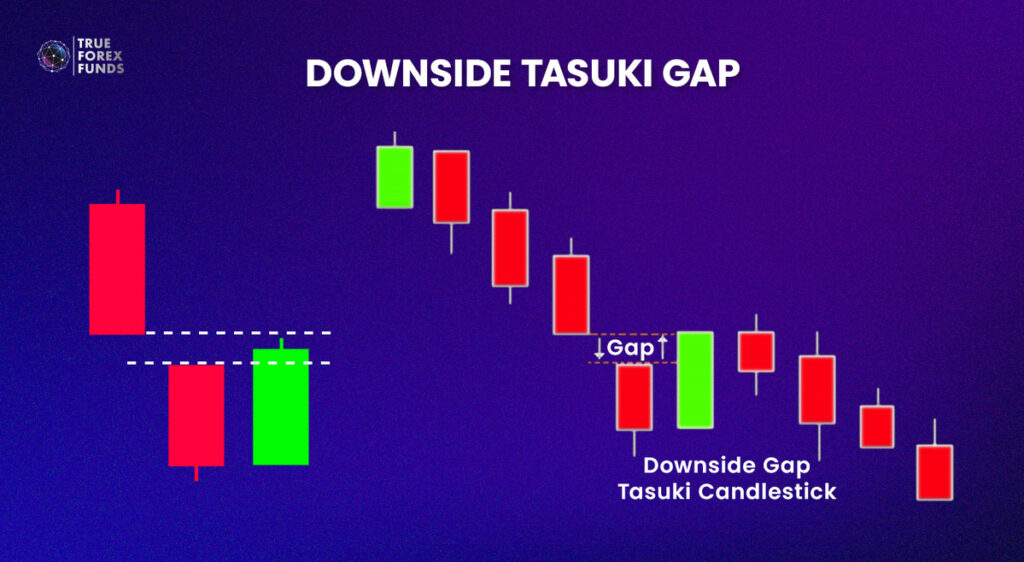
When the market closes with the third candle, it presents a strategic selling opportunity. The gap between the first two candles acts as a resistance zone, signaling an imminent continuation of the downward trend. This pattern is commonly utilized by traders to gauge and capitalize on the ongoing downward momentum in the market.
14. Falling Three Method
This pattern, the Falling Three Method, is not only recognized for its appearance in a downtrend but also for confirming its continuation.
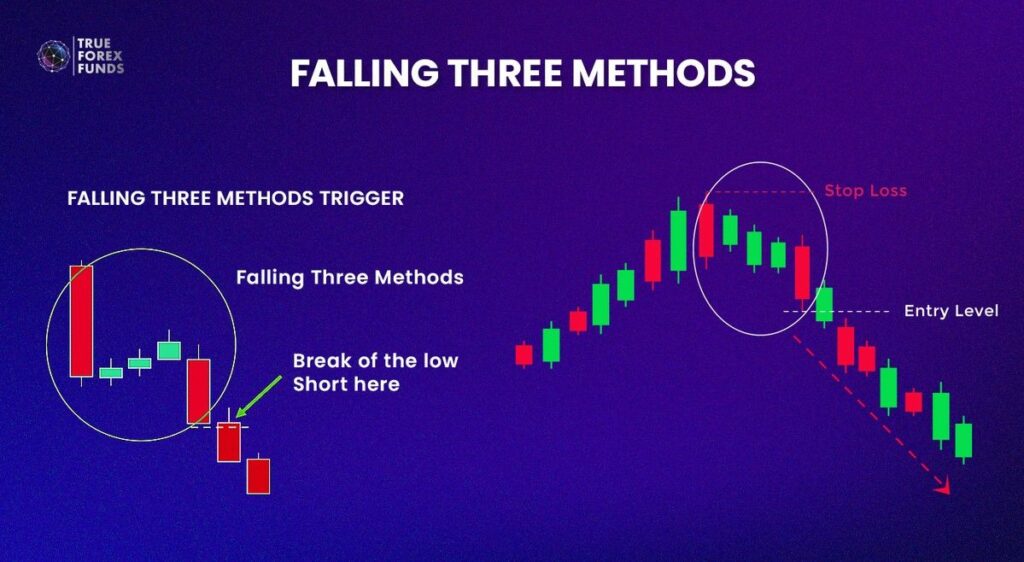
The first candle represents a significant decline in the price trend within the established downtrend, indicating that sellers have assumed control, leading to closure at a notably low level. The three-candle sequence nestled within the body of the first candle signals a scenario where sellers are taking profits while retail investors increase their buying activity, contributing to a modest upward trend in the current market.
However, the fifth candle signifies a robust return to the downward trend, with its closing price typically falling below that of the first candle. This indicates that sellers, regaining control, are likely to swiftly drive the market below the closing price of the initial day.
Conclusion
Mastering bearish candlestick patterns equips traders with invaluable tools to navigate the complexities of financial markets. These visual formations, ranging from the Bearish Marubozu to the Falling Three Method, provide critical insights into market psychology, signaling potential reversals or continuations in downtrends.
Gain Trading Experience With True Forex Fund
To better equip themselves to navigate the ever-changing currents of financial markets, mitigating risks, and capitalizing on opportunities presented by bearish trends.