Traders and chartists have used candlestick charts for their ability to provide insights into market trends. Reversal patterns are important since they signal a possible sudden change in the current market direction. In this article, we’ll take a look at the different types of reversal candlestick patterns and how to interpret their messages.
- Marubozu
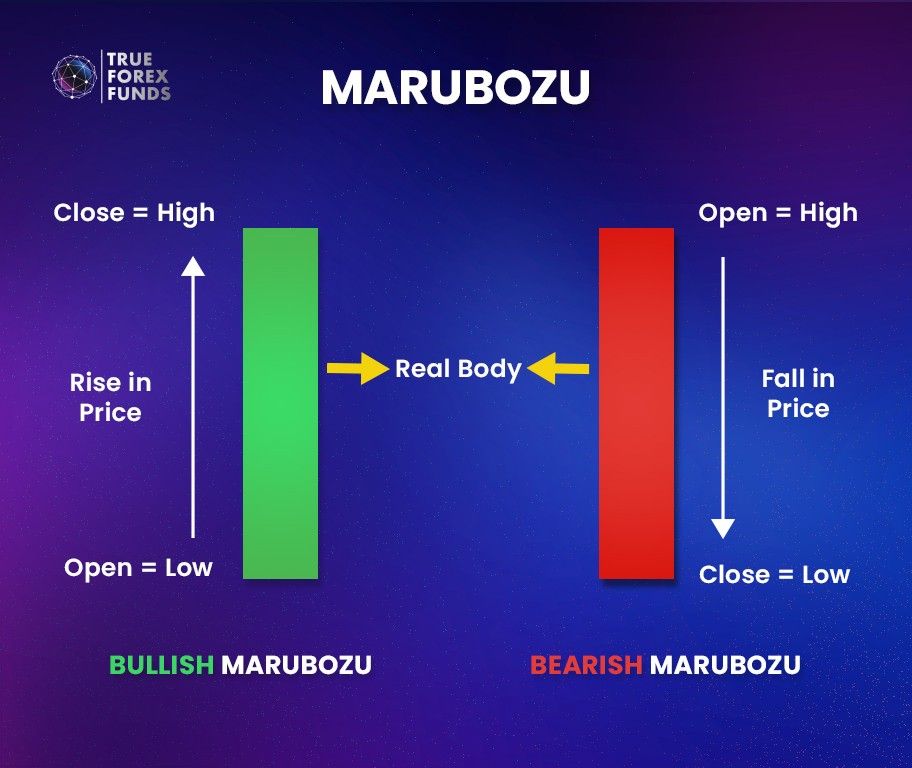
Marubozu is a single candlestick pattern that reflects a strong trend. It is characterized by a long, solid body and little or no shadow.
Bullish Marubozu indicates strong buying momentum while a Bearish Marubozu signifies strong selling pressure.
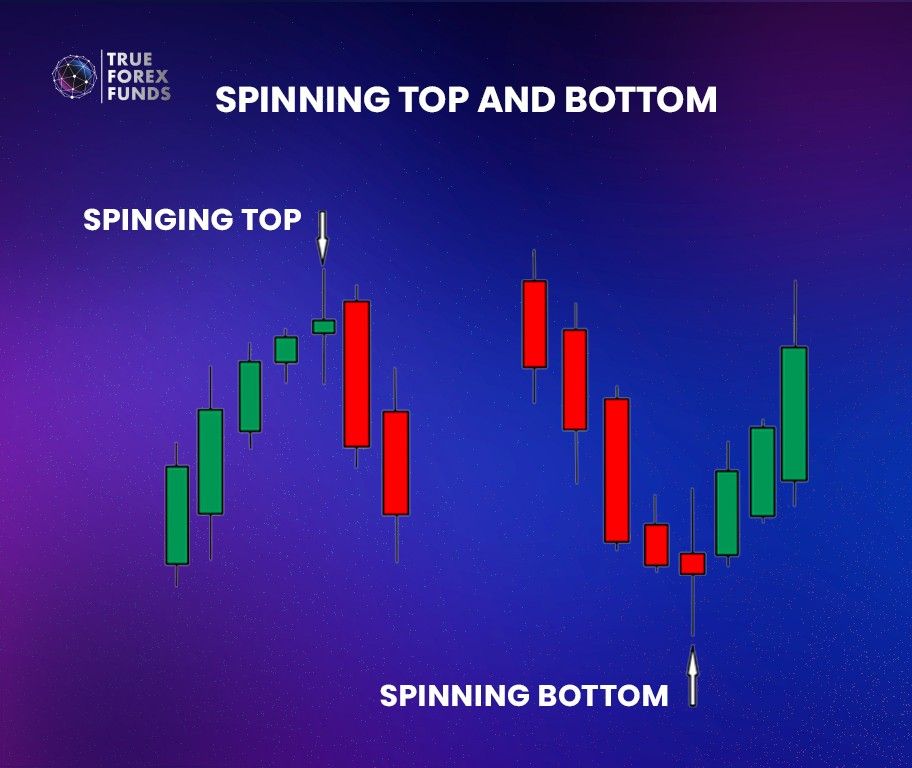
- Spinning Top and Bottom
Spinning Top and Bottom are single candlestick patterns with a small body and long shadows. It represents indecision in the market, where buyers and sellers balance their positions.
Long shadows reflect substantial price volatility in the trading session, with opening and closing prices remaining relatively close. Spinning Top and Bottom depicts an intense struggle between buyers and sellers, leading to a standoff. In the context of an uptrend, the emergence of Spinning Tops indicates buyer hesitancy, potentially signaling a forthcoming market reversal to the downside. Conversely, Spinning Bottom may suggest the possibility of the reversal uptrend in the downward tendency.
- Doji
A Doji is a single reversal candlestick pattern with the open and close prices at the same or nearly the same level, creating a small body with long upper and lower shadows.
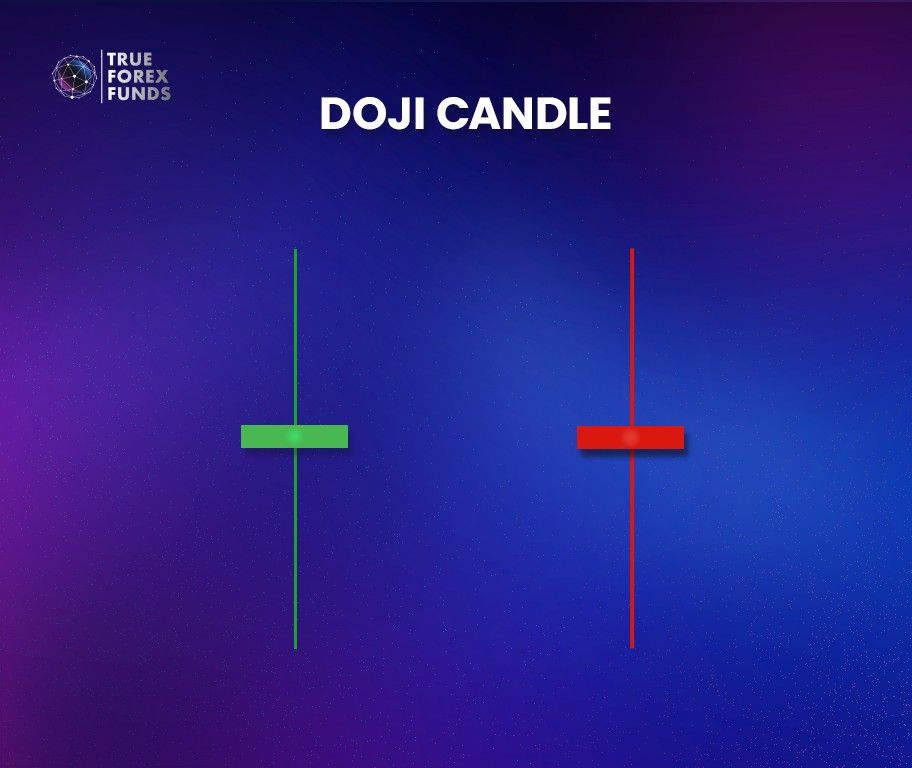
A Doji serves as a signal of market indecision and suggests the possibility of a market reversal, whether in an upward or downward-trending market. When a chart displays a Doji, it implies that the security in question lacks a clear established direction. This pattern indicates indecision or uncertainty regarding future prices.
A Bullish Doji signals a likely bullish reversal, while a Bearish Doji suggests a possible bearish reversal.
- Hammer and Hanging Man
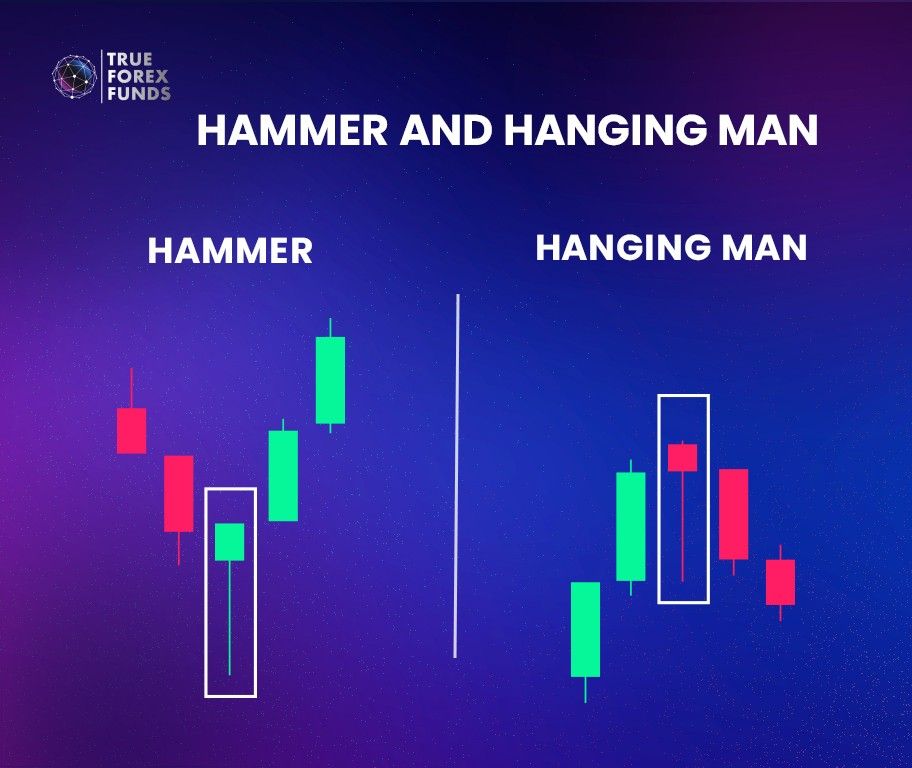
Hammer and Hanging Man are single candlestick patterns that form at the bottom of downtrends and tops of uptrends respectively. They have small bodies with long lower shadows. Hammer suggests a potential bullish reversal while Hanging Man indicates a possible bearish reversal.
- Shooting Star and Inverted Hammer
Shooting Star and Inverted Hammer are single candlestick patterns that share similarities with hammer and hanging man patterns.
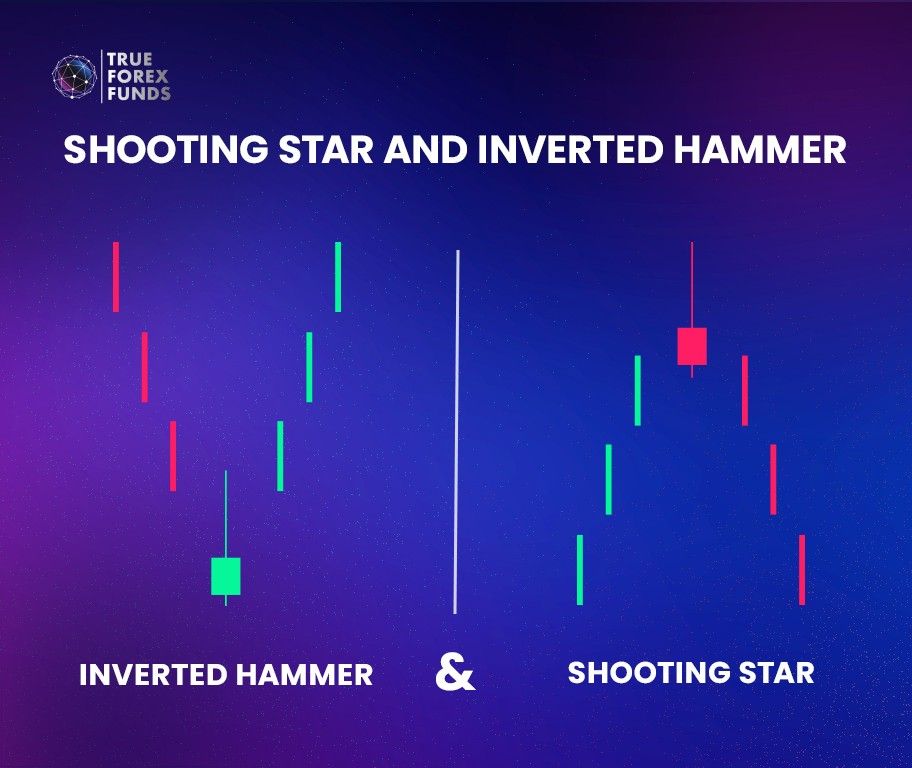
However, the Shooting Star, characterized by a long upper shadow and a small body, indicates a possible bearish reversal. In contrast, with its long upper shadow and small body, the Inverted Hammer suggests a potential bullish reversal.
- Engulfing Patterns
Engulfing patterns are two-candlestick patterns with the second candlestick “engulfing” the first.
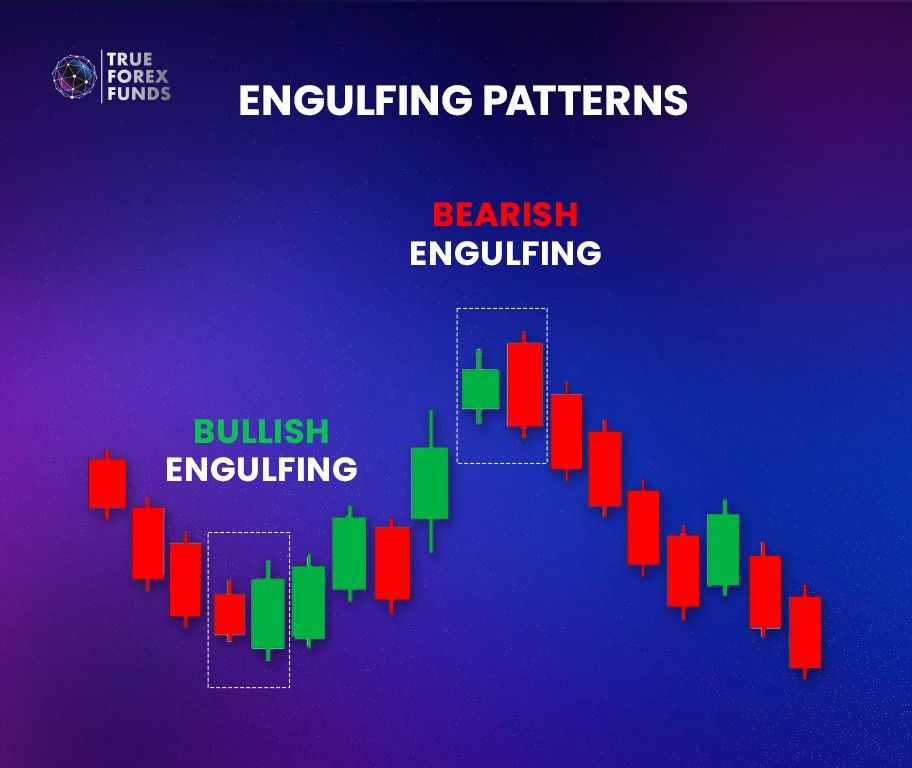
The Bullish Engulfing Pattern starts with a smaller bearish candle followed by a larger bullish candle that completely engulfs the first one. It signals a likely shift from bearish to bullish.
Conversely, the Bearish Engulfing Pattern involves a smaller bullish candle followed by a larger bearish candle that engulfs the preceding candle, indicating a potential reversal from bullish to bearish.
- Tweezer Top and Bottom
Tweezer Top and Bottom are two-candlestick reversal patterns where the high or low of the first candlestick matches the high or low of the second candlestick.
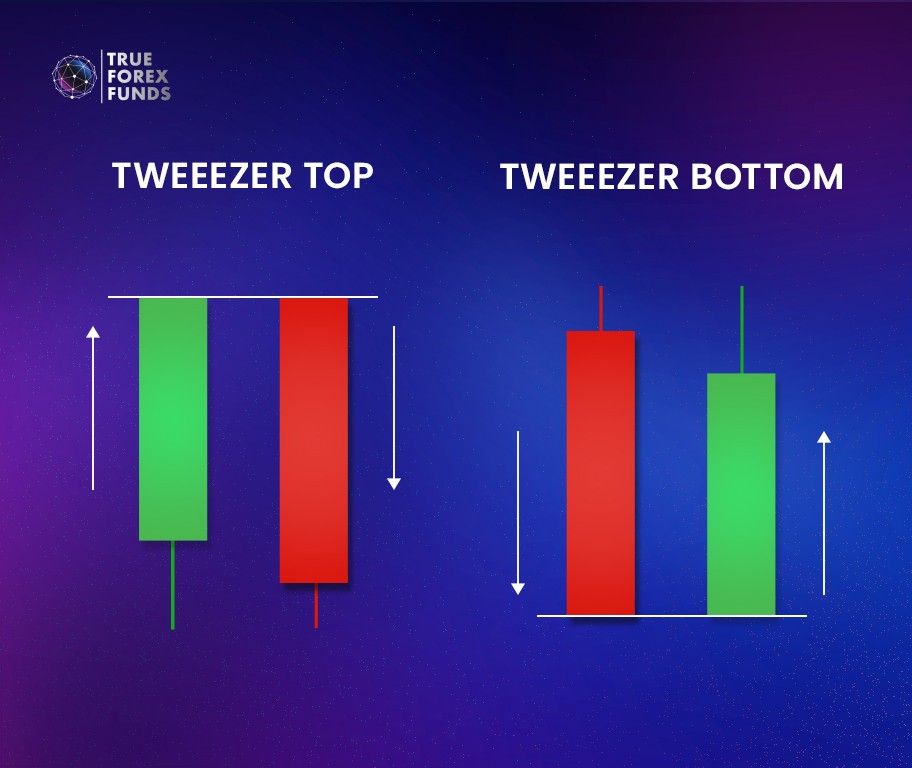
Tweezer Bottoms occur when two consecutive candles have matching or very similar lows. This pattern suggests possible support at that price level and a probable trend reversal from bearish to bullish.
Tweezer Tops, on the other hand, consists of two candles with matching or near-identical highs. This pattern indicates resistance and a probable reversal from bullish to bearish.
- Harami
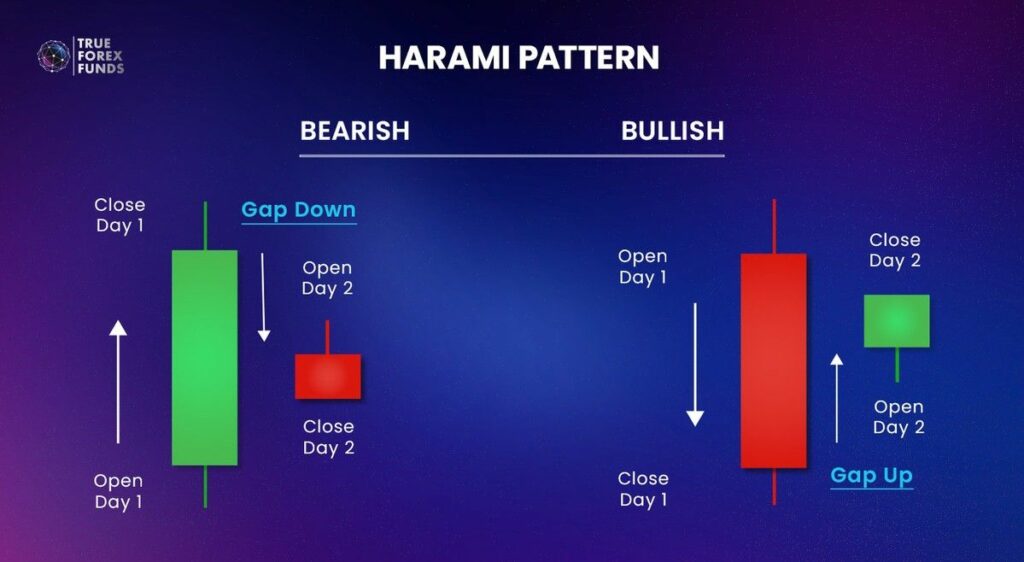
Harami is a two-candlestick pattern with the second candlestick entirely within the range of the first candlestick. The bullish Harami pattern signals a potential bullish reversal while Bearish Harami suggests a possible bearish reversal.
- Dark Cloud Cover and Piercing Pattern
Dark Cloud Cover and Piercing Pattern are two-candlestick patterns.
Dark Cloud Cover is formed by a sizable bullish candle, succeeded by a significant bearish candle that opens higher than the prior candle’s closing price, creating a gap and ends below the midpoint of the bullish candle. This pattern hints at a possible reversal to a bearish trend.
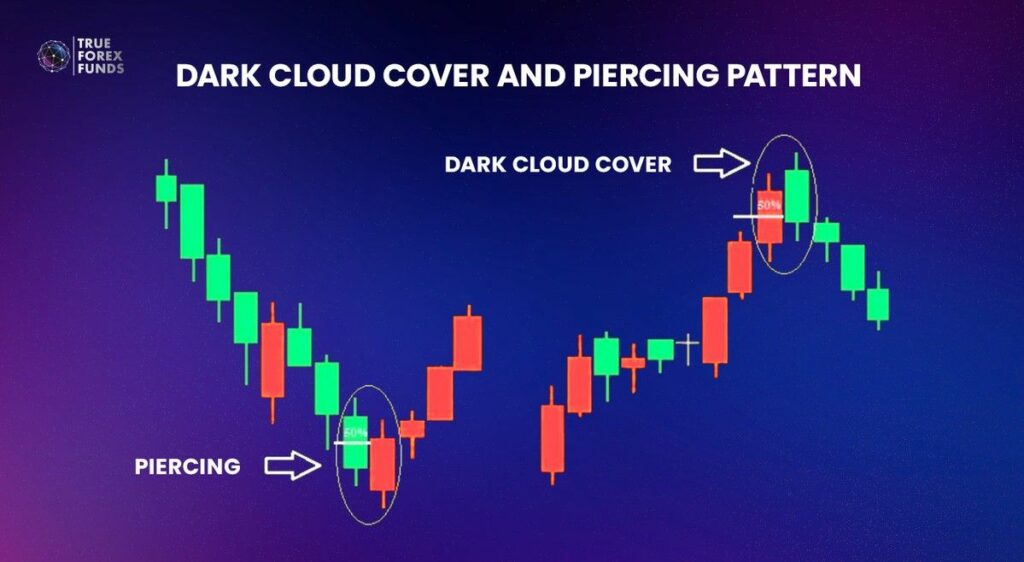
Conversely, the Piercing Pattern is the opposite of the dark cloud cover, signaling a potential reversal to a bullish trend.”
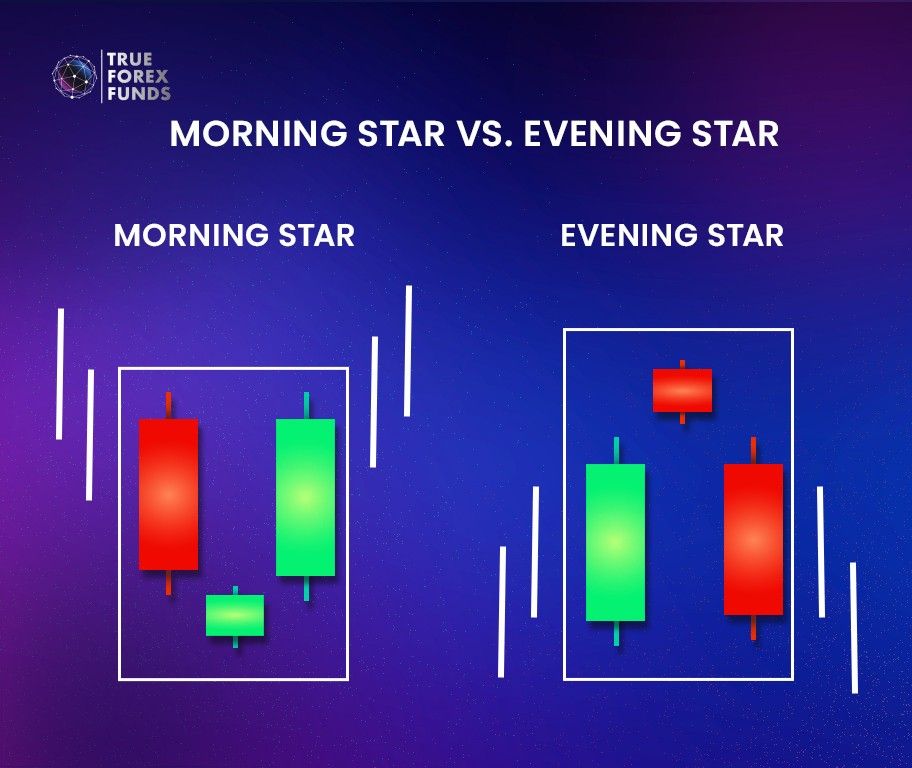
- Evening Star and Morning Star
The Evening Star and Morning Star are both three-candlestick patterns. The Evening Star pattern unfolds after an uptrend, starting with a bullish candle, followed by a doji or spinning top, and concluding with a bearish candle. This pattern suggests the possibility of a bearish reversal. In contrast, the Morning Star pattern is the opposite of the Evening Star, indicating a potential bullish reversal.
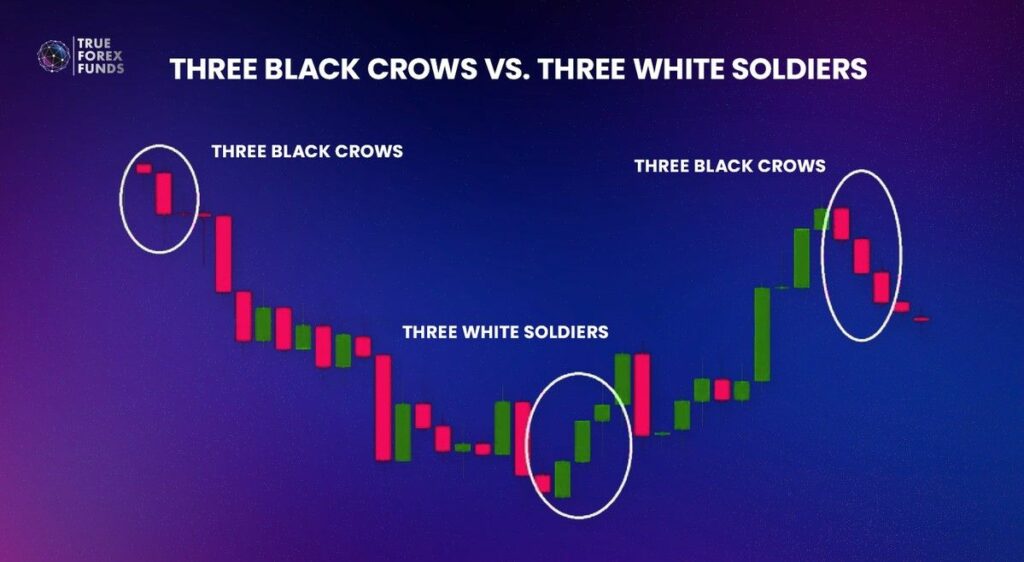
- Three White Soldiers vs. Three Black Crows
Three White Soldiers and Three Black Crows are three-candlestick reversal patterns occurring at the end of a trend. Three White Soldiers indicate a potential bullish reversal while Three Black Crows signal a possible bearish reversal.
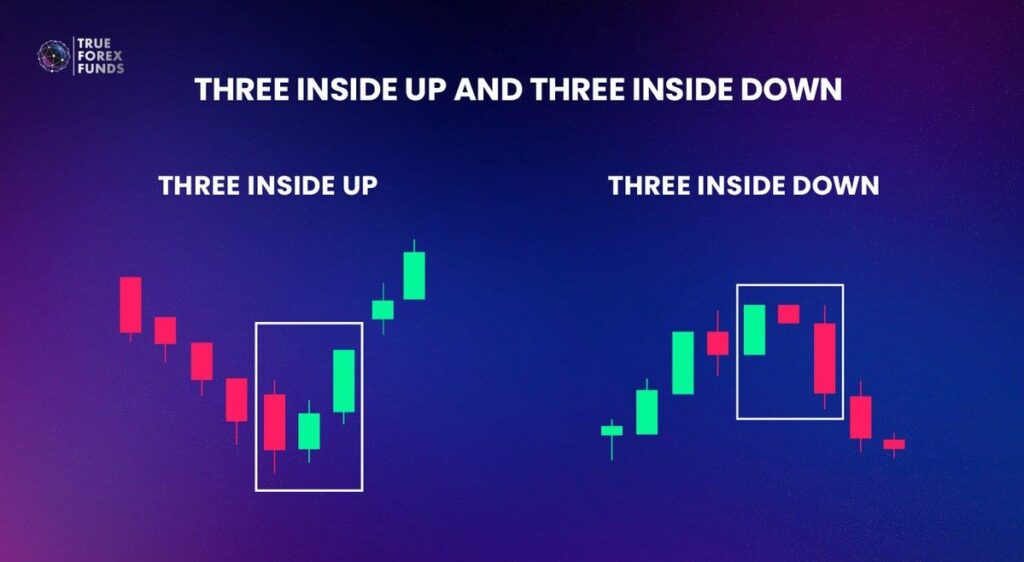
- Three Inside Up and Three Inside Down
Three Inside Up and Three Inside Down are three-candlestick patterns that emerge following the trend. Three Inside Up hints at a prospective shift to a bullish reversal, while Three Inside Down signifies the possibility of a bearish reversal.
Start Practicing Today with True Forex Funds!
While no pattern can guarantee one hundred percent accuracy in detecting trend reversals, a combination of the different patterns can help to increase the probability of success. Keeping an eye out for these candlestick patterns can help traders make informed trading decisions.