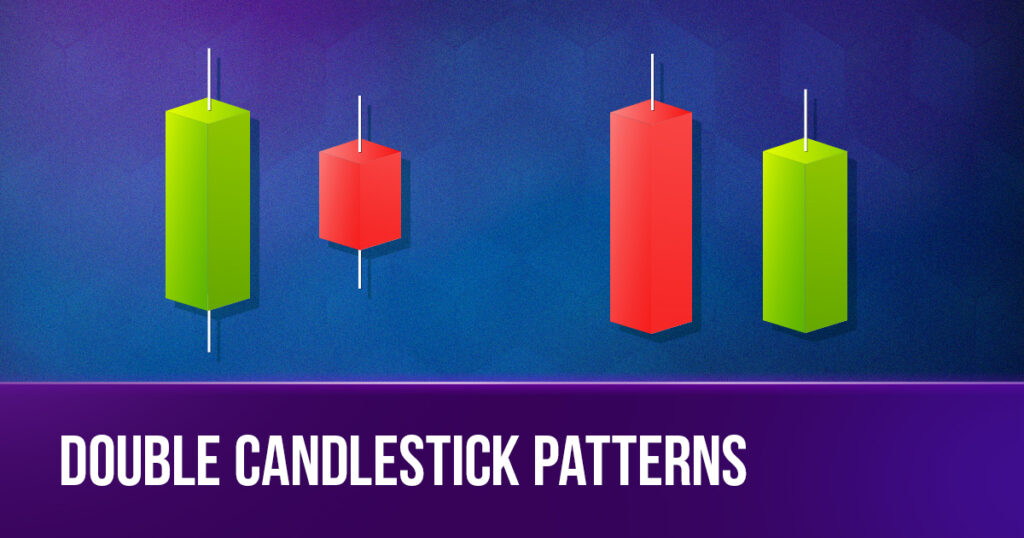
Candlestick patterns have long been a cornerstone of technical analysis in the world of trading. While single candlestick patterns are powerful on their own, double candlestick patterns take this analysis a step further by incorporating the dynamics of two consecutive candles. In this article, we will delve into the more complex world of double candlestick patterns.
1&2. Bullish vs. Bearish Engulfing Patterns

Engulfing patterns are strong reversal signals, and they come in two main varieties: bullish and bearish engulfing patterns.
Features
1. Bullish Engulfing Pattern: This double candlestick pattern, with the first being a smaller bearish candle, followed by a larger bullish candle that completely engulfs the previous candle’s range. The bullish engulfing pattern indicates a potential trend reversal from bearish to bullish.
2. Bearish Engulfing Pattern: In contrast, the bearish engulfing pattern comprises a smaller bullish candle followed by a larger bearish candle that engulfs the prior candle. This pattern suggests a potential reversal from bullish to bearish.
Messages
The message conveyed by engulfing patterns is clear. A bullish engulfing pattern indicates that the buyers have gained control and that a bullish trend may be on the horizon. Conversely, a bearish engulfing pattern suggests that sellers are taking over, signaling a potential bearish trend.
3. & 4. Tweezer Top vs. Tweezer Bottom
Tweezer patterns are characterized by two candles with matching highs (tweezer tops) or lows (tweezer bottoms), signaling potential reversal trends.

Features
1. Tweezer Tops: Tweezer tops consist of two candles with matching or near-identical highs. This pattern indicates potential resistance and a potential reversal from bullish to bearish.
2. Tweezer Bottoms: Tweezer bottoms, on the other hand, occur when two consecutive candles have matching or very similar lows. This pattern suggests potential support at that price level and a possible trend reversal from bearish to bullish.
Messages
Tweezer patterns deliver a message of market indecision. When tweezer bottoms form, often in a downtrend, it suggests a possible reversal to an uptrend. In a downtrend, both buyers and sellers create a tug-of-war, preventing the product’s lowest price from being pushed further in the next session, with buyers gaining the upper hand.
Conversely, tweezer tops appear in an uptrend, signaling a potential reversal to a downtrend. It indicates that sellers are exerting selling pressure to prevent consecutive price increases, while buyers also wrestle for their position, forming a price resistance level in two consecutive sessions.”
5. & 6. Bullish vs. Bearish Harami
With the features adverse to engulfing patterns, the harami patterns are candlestick patterns that often signal trend reversals.
Features
1. Bullish Harami: The bullish harami is a double candlestick pattern in which the first candle is a large bearish one, followed by a smaller bullish candle entirely contained within the previous candle’s range. This pattern suggests a potential bullish reversal.
2. Bearish Harami: In contrast, the bearish harami consists of a large bullish candle followed by a smaller bearish candle completely enclosed within the prior candle. It indicates a potential bearish reversal.

Messages
Harami patterns indicate a possible change in the direction of the market.
A bullish harami suggests that a downward trend might be losing its strength, and a reversal towards an upward trend could be coming. This happens when sellers are dominant, but suddenly buyers start to push back, and by the end of the trading session, it’s clear that the buyers are gaining the upper hand.
Conversely, a bearish harami signals a potential weakening of an upward trend and the possibility of a shift toward a downward trend. In this case, when buyers are in control, and then selling pressure emerges, there’s a struggle between both sides, with the sellers trying to take over the market.
7. & 8. Piercing Pattern vs. Dark Cloud Cover
The piercing pattern and dark cloud cover are also indicative of potential reversals.

Features:
1. Piercing Pattern: The piercing line is a two-candle pattern. It begins with a bearish candle followed by a bullish candle that opens below the previous candle’s close and closes above its midpoint. This pattern suggests a potential bullish reversal.
2. Dark Cloud Cover: The dark cloud cover is the opposite of the piercing line. It starts with a bullish candle followed by a bearish candle that opens above the previous candle’s close and closes below its midpoint. This pattern indicates a potential bearish reversal.
Messages:
The piercing pattern indicates that following a strong bearish trend, a bullish comeback may be in the making. In a pronounced downtrend, the emergence of this pattern shows that buying interest is prevailing and reducing the selling pressure.
On the other hand, the dark cloud cover pattern implies that after a strong bullish trend, the bears might regain control. In an uptrend with strong buying activity, when the selling pressure becomes more significant, it suggests a shift in favor of the sellers.
Understanding Double Candlestick Patterns For Successful Navigation
Understanding these eight common double candlestick patterns is essential for traders looking to make informed decisions in the financial markets. By recognizing these patterns and their associated messages, traders can improve their ability to predict potential trend reversals or continuations.
Understanding Patterns by Practice Today!
To facilitate your learning journey, True Forex Funds offers balance options of up to $400,000, starting at just €89. This opportunity allows you to explore and learn from your mistakes without incurring substantial costs, making it easier to grasp these critical patterns.


