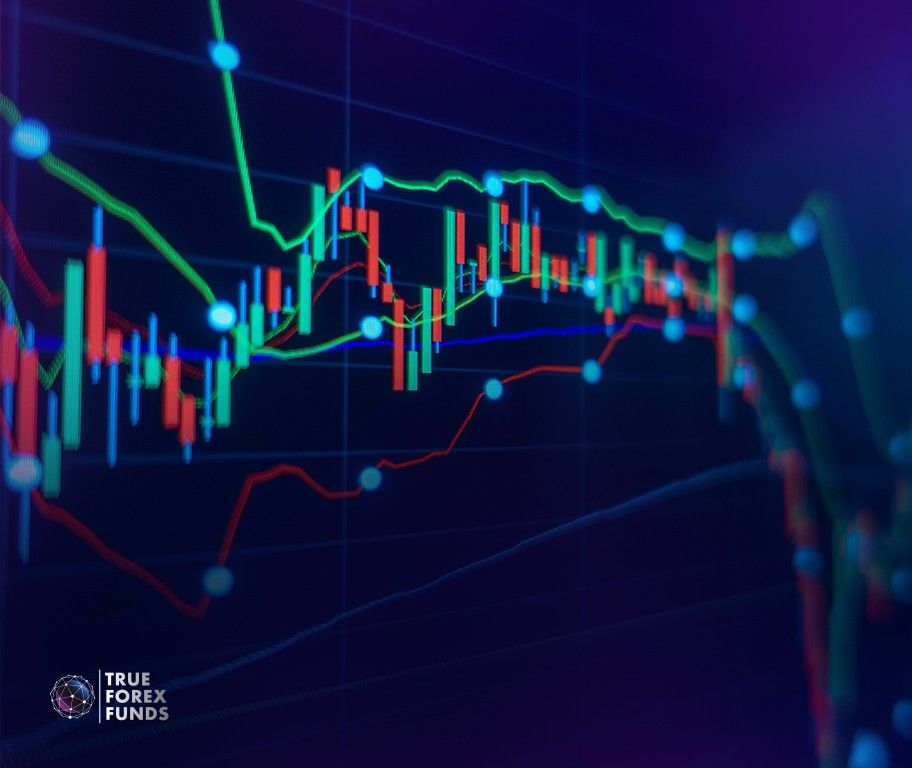
Forex traders use candlestick patterns as one of the most popular tools for analyzing markets.Since they provide a visual representation of price movement, forex traders will find it easier to identify trends and make informed trading decisions.
What are Candlestick Patterns?
Candlestick patterns are the analytical framework that combines multiple individual candlesticks to form recognizable patterns on price charts.
If each candlestick delivers four key pieces of data: opening, closing, highest, and lowest prices within the selected timeframe, candlestick patterns provide visual representations of how price action unfolds over a specific period, whether it be minutes, hours, days, or longer.
You can think of this analogy: the candlestick as a musical note, while the candlestick patterns compose the symphony of market insights.
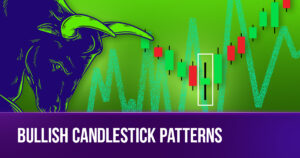
Candlestick patterns have been developed and refined over centuries, with specific names like “doji,” “hammer,” “engulfing,” and “hanging man,” among others. By recognizing these essential patterns, traders can gain a competitive edge in the financial markets.
Join The World of Candlestick Patterns with True Forex Funds!
Get fundedAdvantages of Candlestick Patterns
- Market Overview: Candlestick patterns may reveal whether buyers or sellers are dominant. For example, a long red body suggests strong selling pressure, while a green one indicates robust buying.
- Price Action Signals: Unique candlestick patterns at key points signal potential trend reversals or continuations, helping traders make informed entry and exit decisions.
- Trading Sentiments: Candlestick characteristics such as the length of each part length convey the emotional state of market participants, aiding traders in understanding market psychology and predicting price movements.
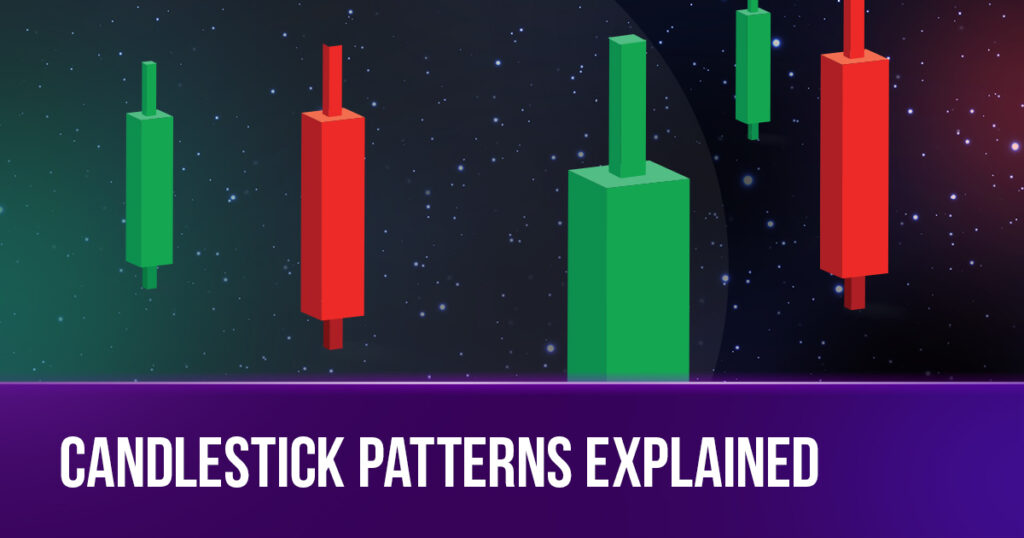
What is a Candlestick Made Of?
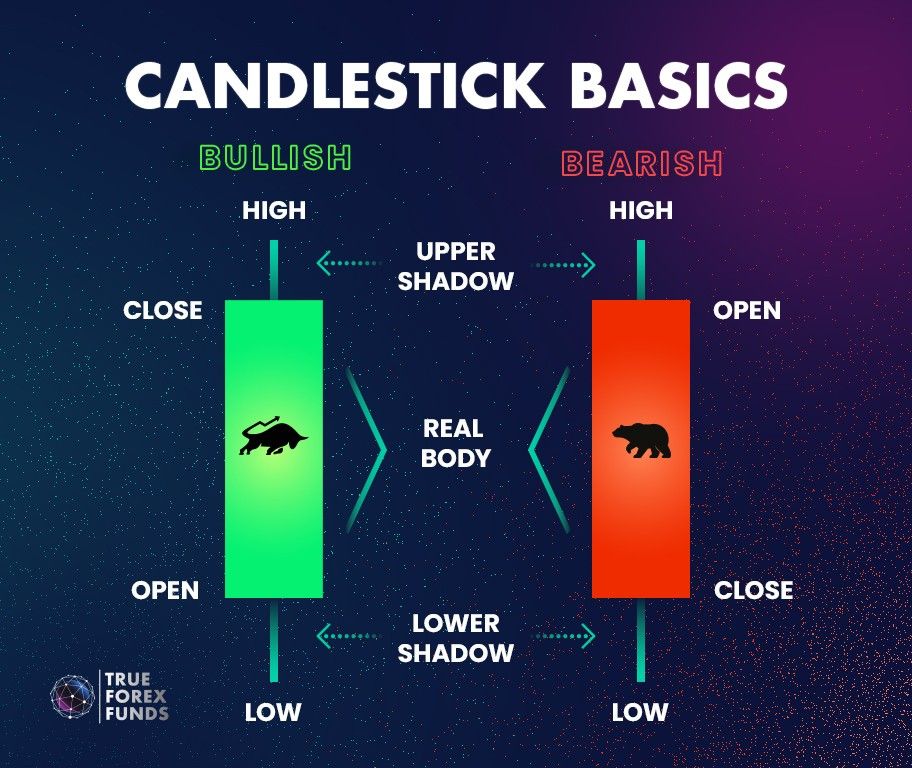
A standard candlestick has two main components: the real body and the shadows:
- Real Body: represents the range of price fluctuation between the opening price and the closing price, which means starting and final price in a trading session within a specific time period
- Shadows represent the highest (in the upper part) and lowest prices (in the lower part) within the session.
- Candlesticks are also color-coded to represent price movement: green for increase, red for decrease.
The Beginner’s Guide to Read Candlestick Patterns
Each candle represents information for the time frame chosen by the trader. For example, if a trader selects a fifteen-minute time frame, then a new candle will be created every fifteen minutes. To make it easier to visualize, look at the example below:
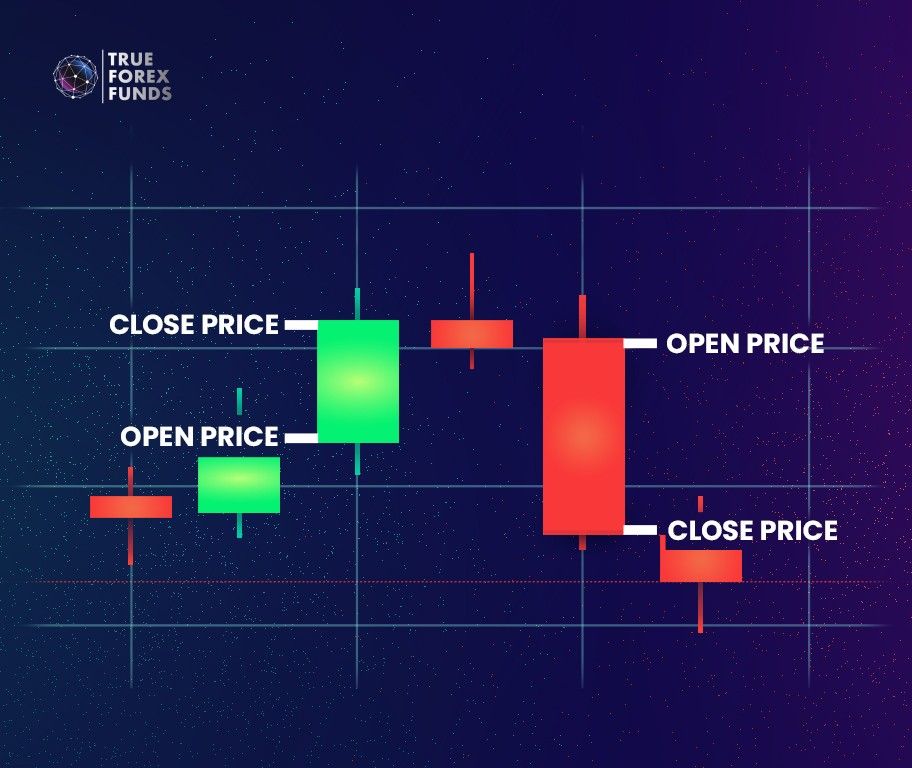
- Open Price: Depending on whether the price is increasing or decreasing within the fifteen-minute period, the open price will be at the top or bottom of the candle’s body. If the price is trending upwards (bullish), the candle will be green, and the open price will be at the bottom. Conversely, if the price is trending downwards (bearish), the candle is usually red, and the open price will be at the top. Sometimes, they represented candlesticks in monochrome, where white means bullish, and black means bearish.
- Closing Price: Similarly, depending on whether the candle is bearish or bullish, the closing price will be at the opposite end of the candle.
Types to Classify Candlestick Patterns
There are numerous methods to classify candlestick patterns. For starters, we’ll simplify this classification into two broad categories: simple and complex patterns.
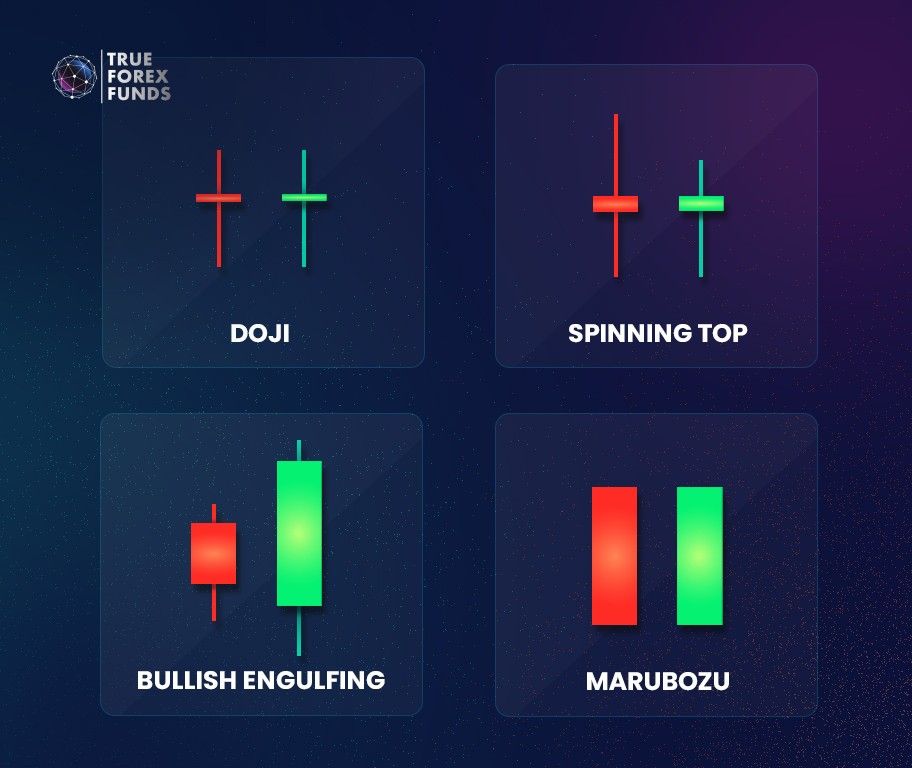
Simple Patterns
Simple Candlestick Patterns are those that consist of single-candle formations or straightforward two-candle combinations. They are relatively easy to identify and interpret, making them ideal for traders looking for quick signals. Some examples are Doji, Spinning Top, Bullish Engulfing, Marubozu, etc.
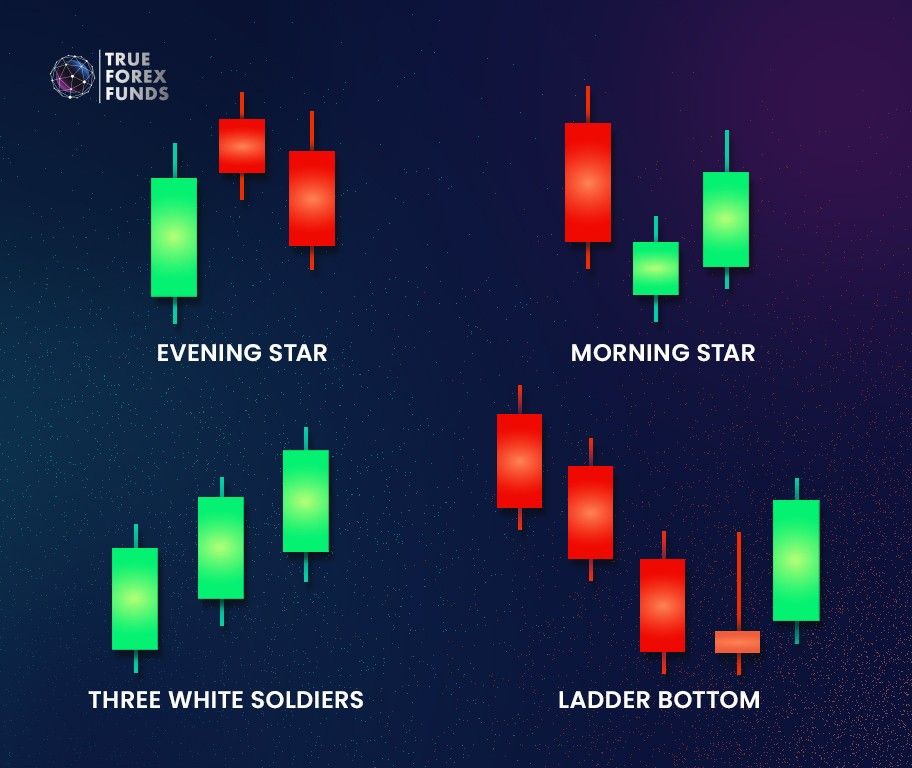
Complex Patterns
Complex Candlestick Patterns, on the other hand, require a deeper analysis of three or more candlestick patterns and their interplay. Experts often consider these patterns more powerful because they involve intricacies in their recognition. Examples encompass Evening Star, Morning Star, Three White Soldiers, Ladder Bottom, etc.
Conclusion
Understanding candlestick patterns and how to read them can significantly enhance your skills as a forex trader. While it may seem challenging at first, starting from just one candlestick and building a solid pattern analysis foundation would be a valuable investment in your trading career.