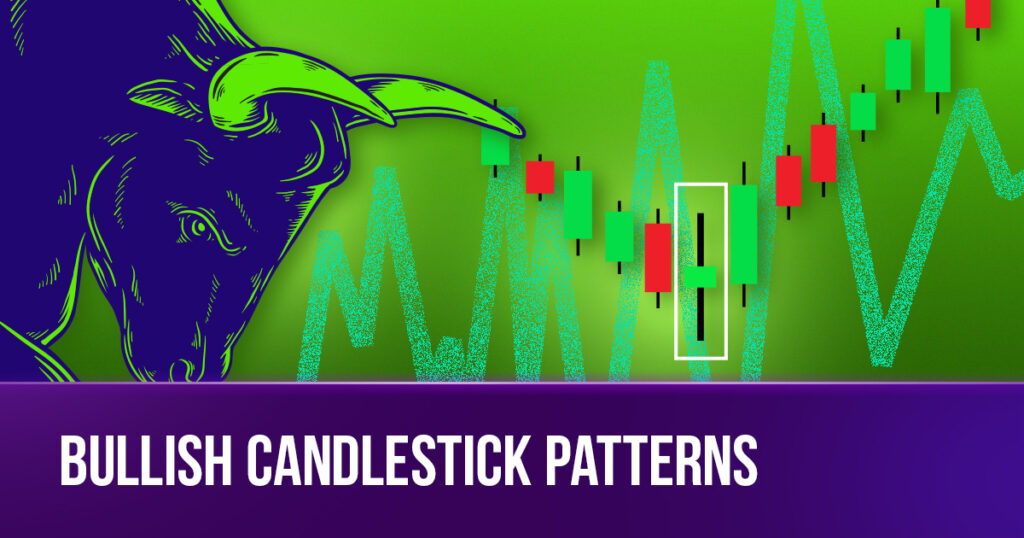
Understanding candlestick patterns is one of the most crucial technical skills for forex traders. Bulls represent optimism, while bears signal caution. Today, we’ll delve into the bullish side, exploring 14 key bullish candlestick patterns that signal market optimism.
1. Bullish Marubozu
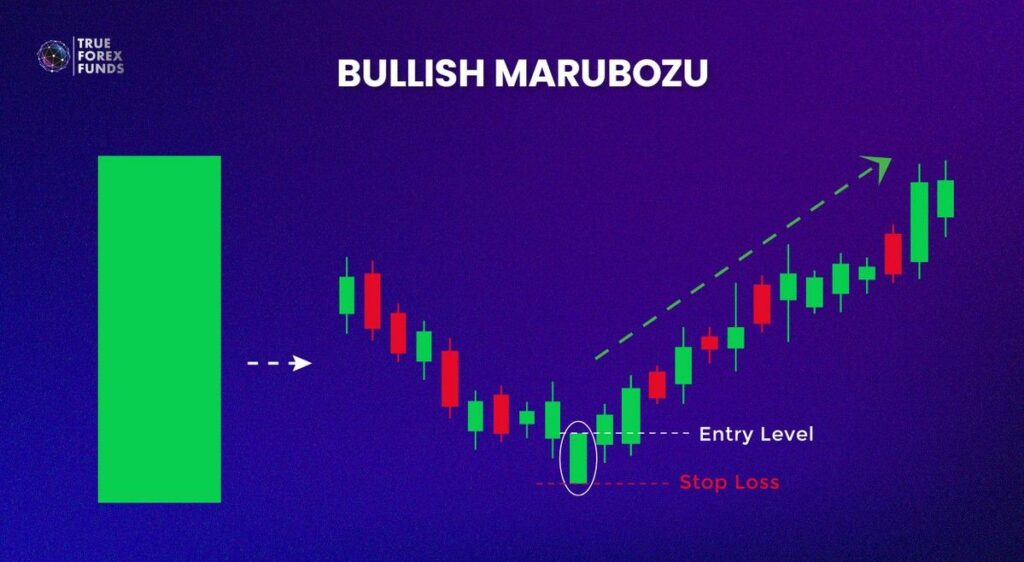
In Japanese, “Marubo” means a large block or shape. A Bullish Marubozu, depicted by a rising green candle, features a large body with minimal or no shadows. Its opening and closing prices nearly align with either the highest or lowest point of the trading session.
The prominence of a green Marubozu candle indicates a market scenario where buyers dominate, fostering a smoother upward price movement.
2. Spinning Bottom (Bullish Spinning Top)
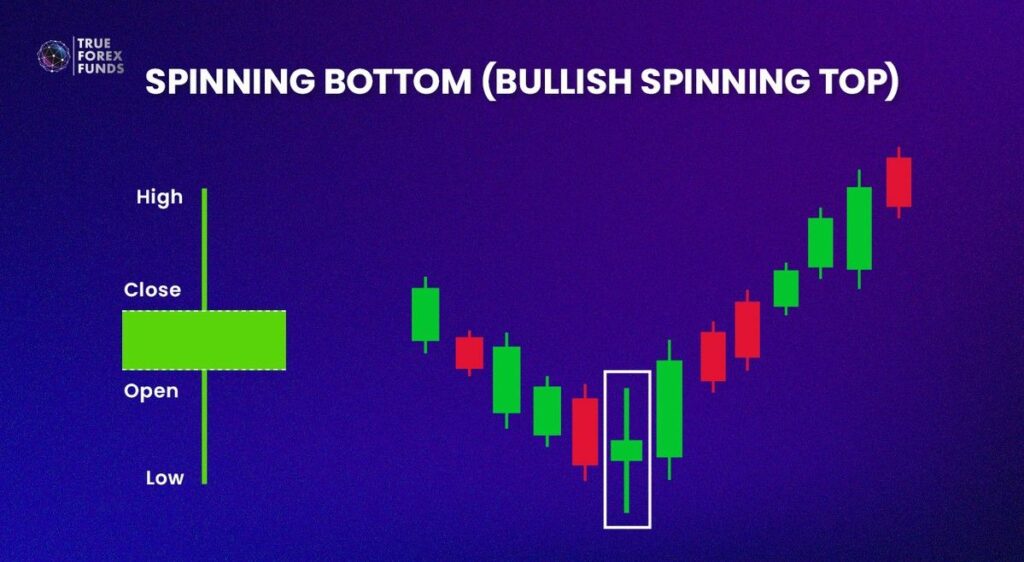
Spinning Bottoms, the green bullish candlestick pattern, have a moderately small body with long shadows extending well beyond the body. The long shadows indicate significant price volatility during the trading session, while the opening and closing prices are relatively close.
Spinning Bottoms shows a fierce battle between buyers and sellers, resulting in a tie. Spinning Bottoms often appear in the market, suggesting that sellers are becoming hesitant, possibly signaling a potential market reversal.
3. Bullish Doji
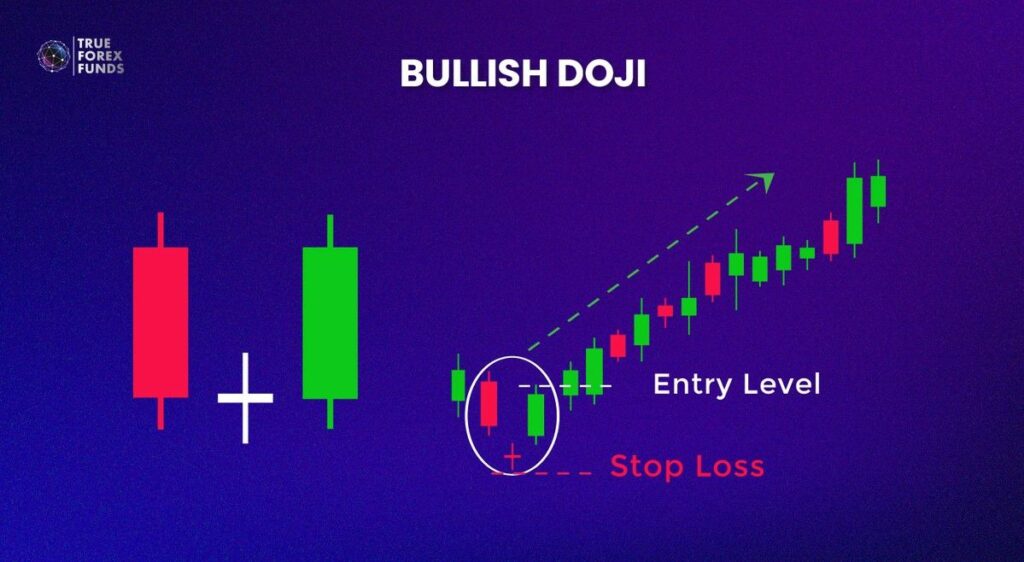
A Bullish Doji is a green single candlestick pattern, often appearing in a downward chart. It is characterized by opening and closing prices that are nearly identical, resulting in a small body with extended upper and lower shadows.
When a Doji appears, it signals a lack of a clear established direction for the security, indicating a state of indecision or uncertainty among market participants about future prices. There are three variations of Bearish Doji candlestick patterns based on the opening and closing prices.
4. Hammer
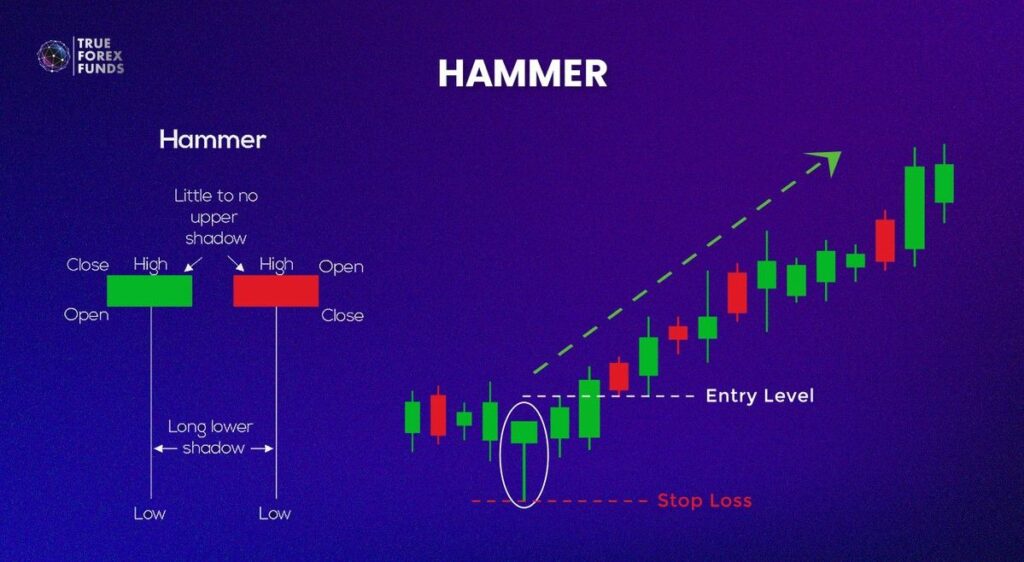
A Hammer is a single bullish candlestick pattern that emerges at the bottom of downtrends. It features a lower shadow at least twice as long as its body, and the upper shadow may be either very short or nonexistent.
A green Hammer, where the closing price equals the highest price, suggests a strong potential for an upward movement in stock prices. Conversely, a Red Hammer, with the opening price equaling the highest price, indicates a mild increase.
5. Inverted Hammer
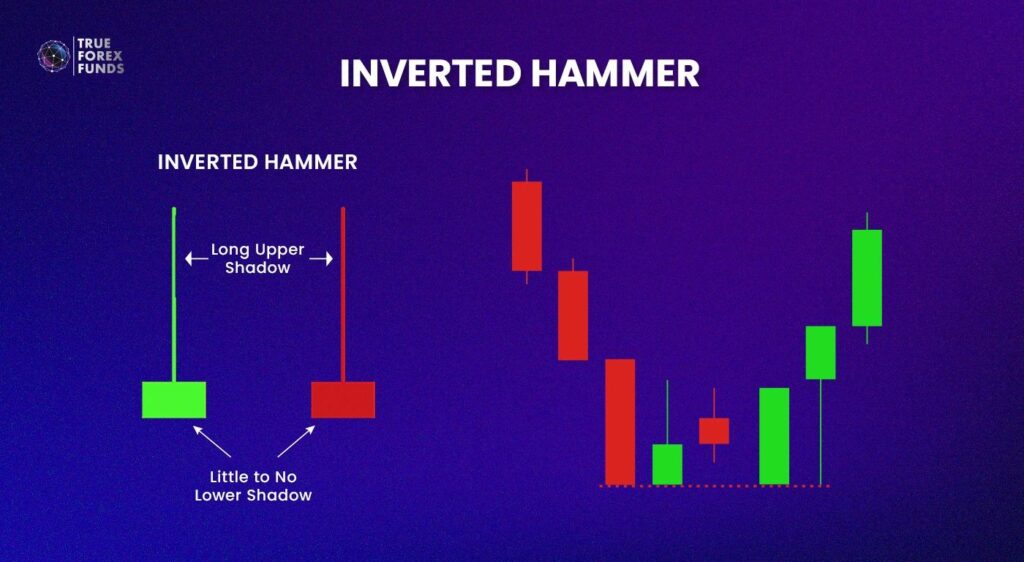
An Inverted Hammer is a single green candlestick pattern characterized by upper shadows at least twice as long as its body, and very short or nonexistent lower shadows.
While similar to the Hammer, the Inverted Hammer suggests a potential market reversal with less certainty. Its presence implies market uncertainty, urging traders to be cautious about a possible shift in the prevailing trend.
6. Bullish Engulfing
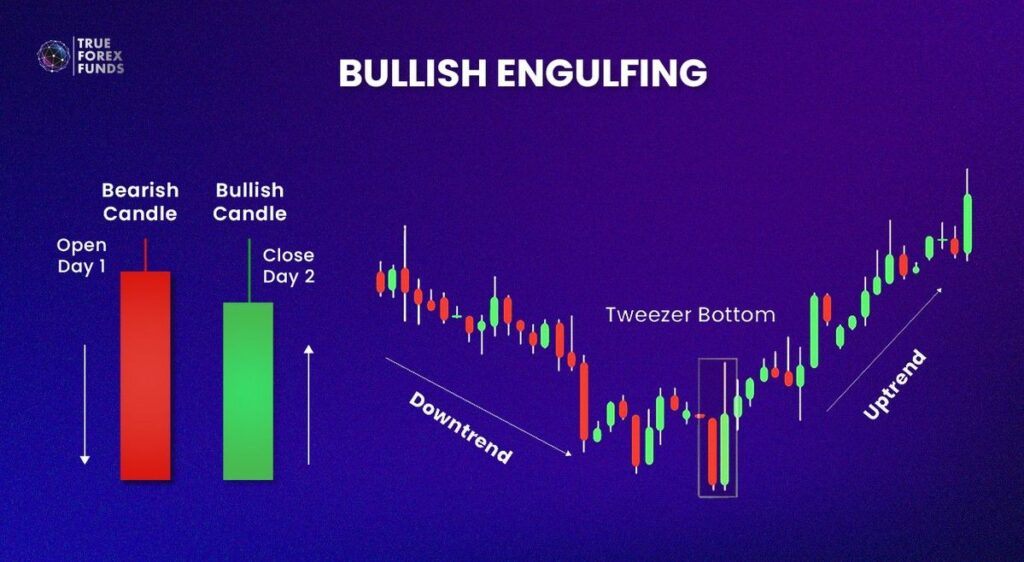
This pattern consists of two candles, with the first being a smaller bearish candle followed by a larger bullish candle that completely engulfs the previous candle’s range.
The message conveyed by engulfing patterns is clear: a bullish engulfing pattern indicates that buyers have gained control, hinting at a potential bullish trend.
7. Tweezer Bottom
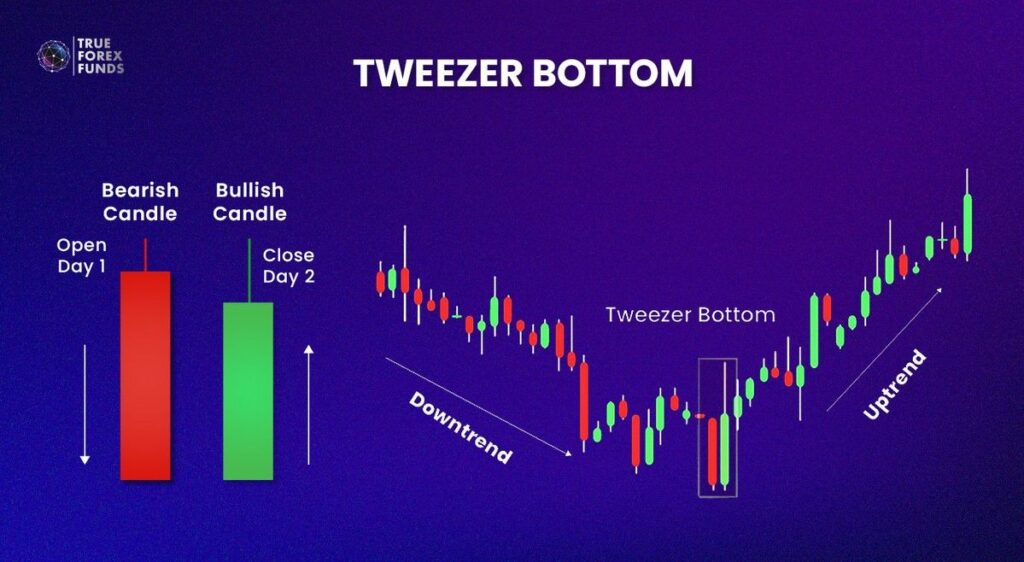
Tweezer bottoms, on the other hand, occur when two consecutive candles have matching or very similar lows. This pattern suggests potential support at that price level and a possible trend reversal from bearish to bullish. Tweezer patterns deliver a message of market indecision.
When tweezer bottoms form, often in a downtrend, it suggests a possible reversal to an uptrend. In a downtrend, both buyers and sellers create a tug-of-war, preventing the product’s lowest price from being pushed further in the next session, with buyers gaining the upper hand.
8. Bullish Harami
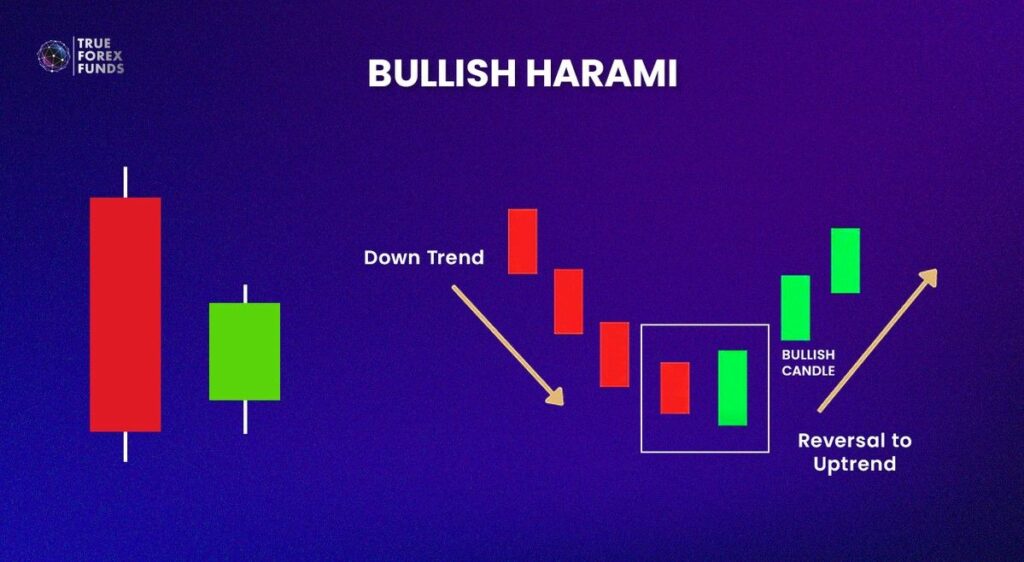
The bullish harami is a two-candle bullish candlestick pattern in which the first candle is a large bearish one, followed by a smaller bullish candle entirely contained within the previous candle’s range. This pattern suggests a potential bullish reversal.
A bullish harami suggests that a downward trend might be losing its strength, and a reversal towards an upward trend could be coming. This happens when sellers are dominant, but suddenly buyers start to push back, and by the end of the trading session, it’s clear that the buyers are gaining the upper hand.
9. Piercing Pattern
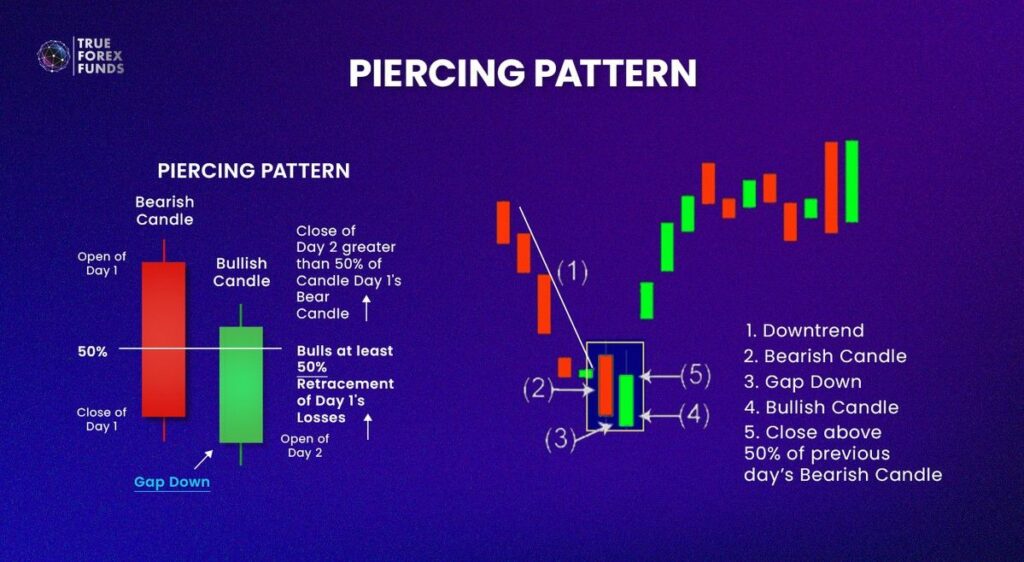
The piercing pattern is a two-candle pattern. It begins with a bearish candle followed by a bullish candle that opens below the previous candle’s close and closes above its midpoint.
The piercing pattern indicates that following a strong bearish trend, a bullish comeback may be in the making. In a pronounced downtrend, the emergence of this pattern shows that buying interest is prevailing and reducing the selling pressure.
10. Morning Star
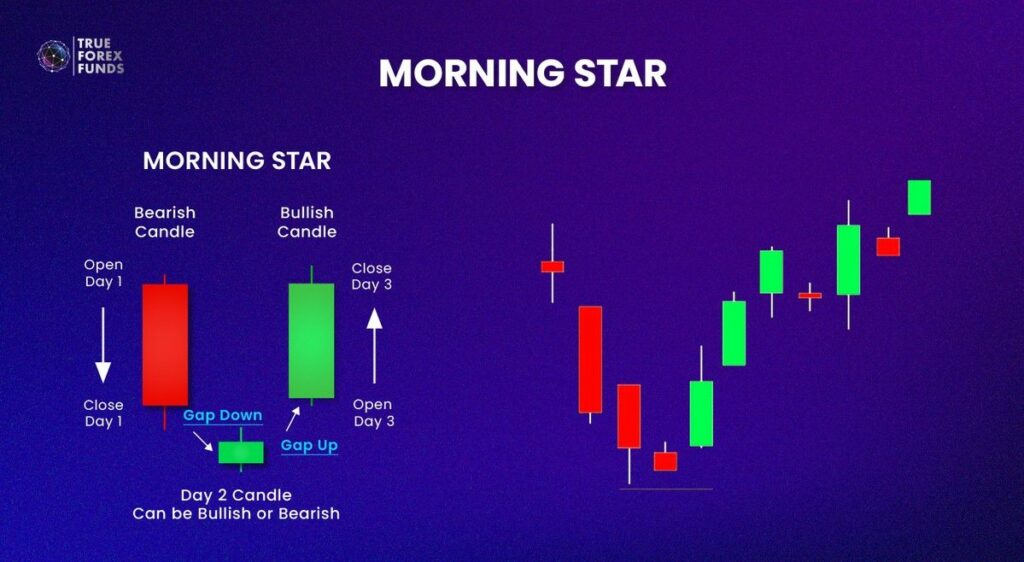
Morning Star very often appears in a bearish trend. The pattern kicks off with a large bearish candle, indicating a prevailing uptrend in the market. Next comes a small bullish or bearish candle, not crossing the body of the initial strong bearish candle. This small candle reflects market indecision. The pattern wraps up with a substantial bullish candle. Importantly, its body shouldn’t cross with the small second candle but must significantly penetrate the body of the first bullish candle (around 2/3 to 3/4 lower end). Therefore, it may suggest a potential shift towards a bullish reversal trend.
11. Three White Soldiers
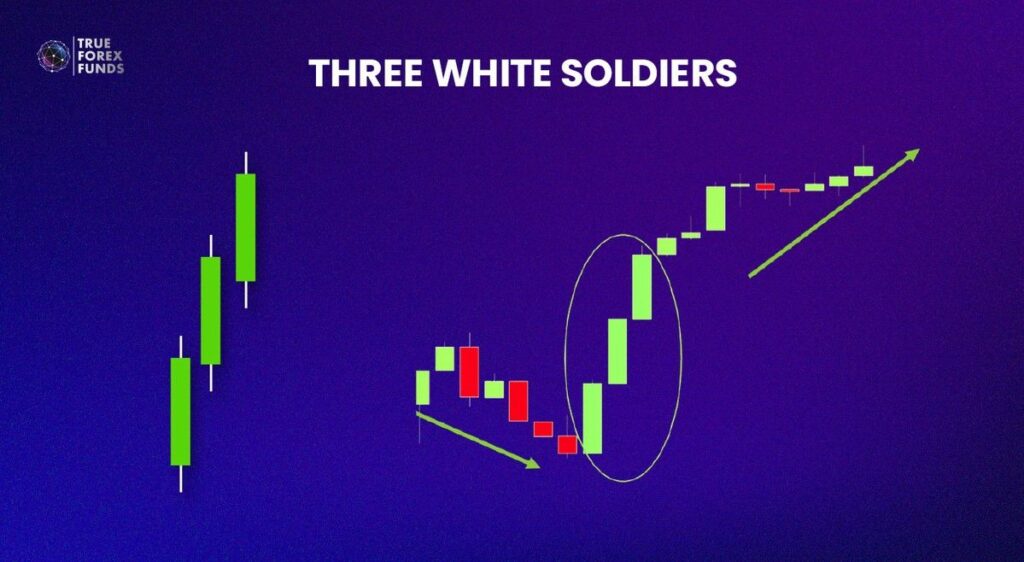
This pattern emerges in bearish trends and comprises three consecutive long bullish candles (white). The first soldier acts as a reversal candle, marking the conclusion of a downtrend or suggesting the end of a consolidation period. The second candle must surpass the previous one in size, closing near its high without a significant upper wick. The third candle should be at least the same size as the second, featuring a small or nonexistent shadow, thereby confirming the ongoing bullish momentum.
When the Three White Soldiers candlestick pattern appears in a downtrend, it signals a strong upward reversal. The underlying idea is that when sellers are dominant, strong buying demand emerges, causing continuous price increases, indicating that buyers are taking the initiative.
12. Three Inside Up
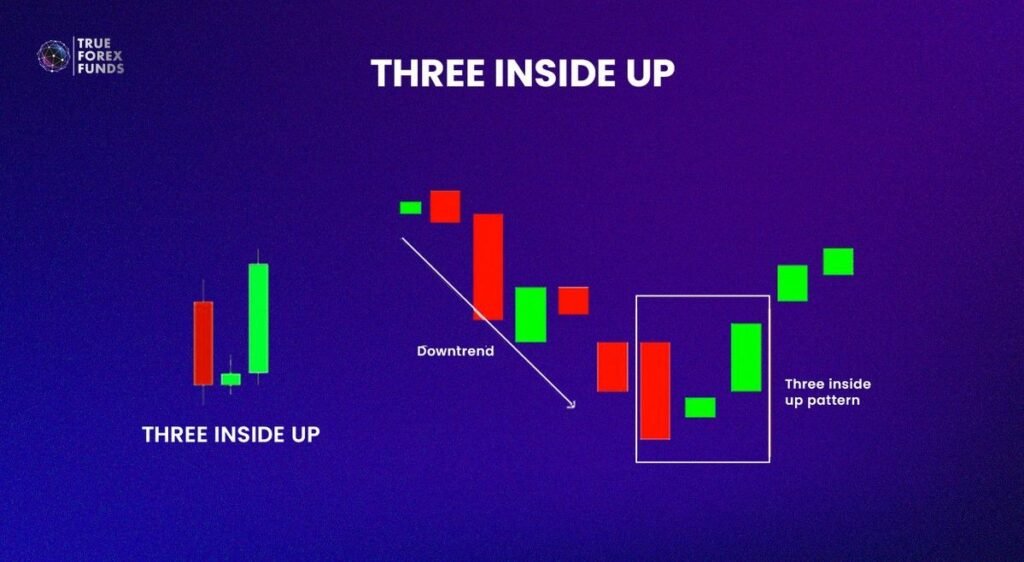
This pattern is commonly observed at the conclusion of a downtrend. The initial candle, positioned at the lowest point of the downtrend, is characterized by an extended bearish candlestick. The second candle is bullish, typically ascending to at least the midpoint of the first candle. The third candle is also bullish and must close above the high of the first candle.
These candles imply that the current trend may be concluding, signaling the initiation of a new reversal trend. The market dynamics of this pattern closely resemble the Morning Star, but it appears more robust. This is evident as the second candle loses more than half of the previous one, and by the third trading period, the reversal trend takes full control of the market.
13. Upside Gap Tasuki
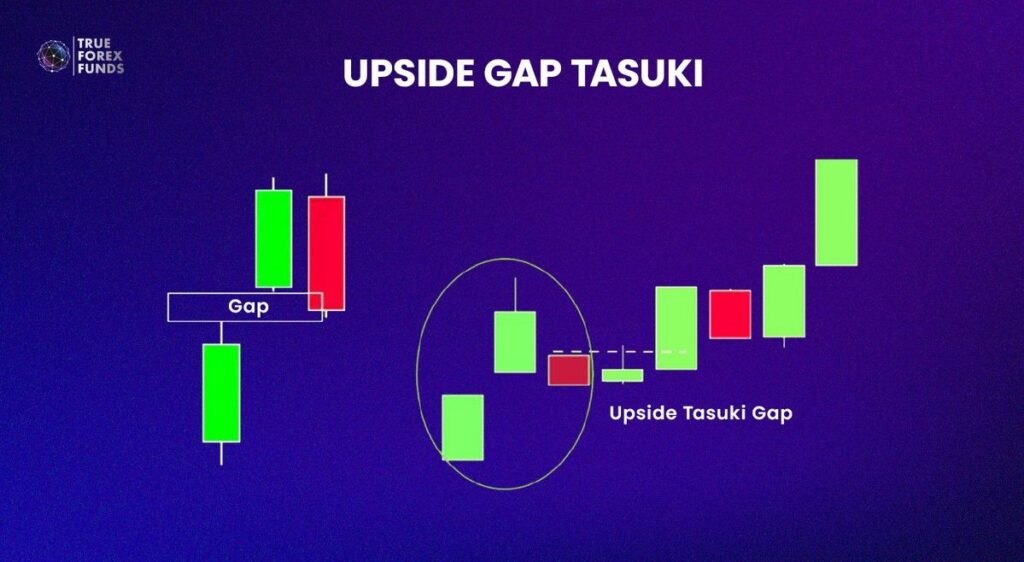
This pattern manifests in an existing uptrend to confirm its continuation. In the first candle, there is a substantial green candlestick within a clearly defined uptrend. The second candle is another green candlestick with an opening price displaying a noticeable gap above the close of the previous bar. The third candle 3 is a red candlestick that contributes to partially closing the gap between the first two bars.
When the market concludes with the third candle, it presents a strategic buying opportunity. The gap between the first and second candles is considered a support zone, indicating an immediate continuation of the upward trend.
14. Rising Three Method
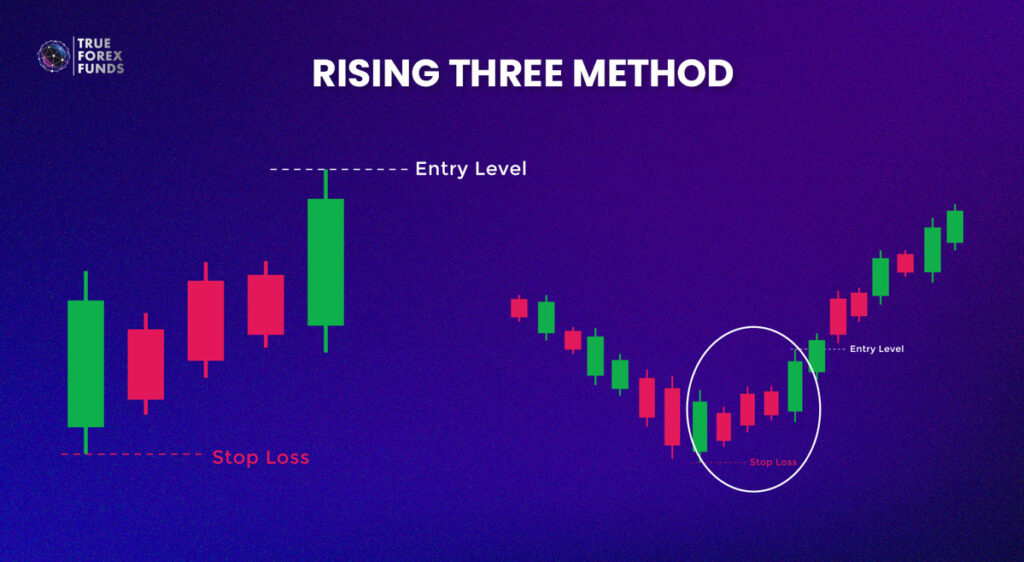
A Rising Three Method is also one of the continuation candlestick pattern types, consisting of five candlesticks. The first candle in this pattern indicates a strong upward price trend emerging from a previously established trend. Next, the three middle candles within this continuation pattern typically have small bodies, lying within the range of the first candle. The fifth candle represents a robust upward trend, and its closing price is usually higher than the closing price of the first candle.
Importantly, the Rising Three Methods pattern offers more accurate predictions when the volume of the first and last candles exceeds the volume of the three middle candles.
Conclusion
As we wrap up this exploration, remember that the mastery of bullish candlestick patterns enhances your ability to make informed decisions, manage risks effectively, and seize opportunities in ever-changing market conditions.
Stay vigilant, stay informed
And may your trading journey be guided by the insights gained from decoding the language of bullish candlesticks.