Exploring candlestick patterns is like unlocking a treasure trove of shapes—single, double, triple, or exciting reversals. In this visual dance of market movements, continuation patterns play a crucial role as silent heroes. They help traders navigate through the twists and turns of market trends. They are subtle hints from the market. Continuation candlestick patterns indicate not just a break but the expectation of the trend making a strong comeback.
What is a Continuation Candlestick Pattern?
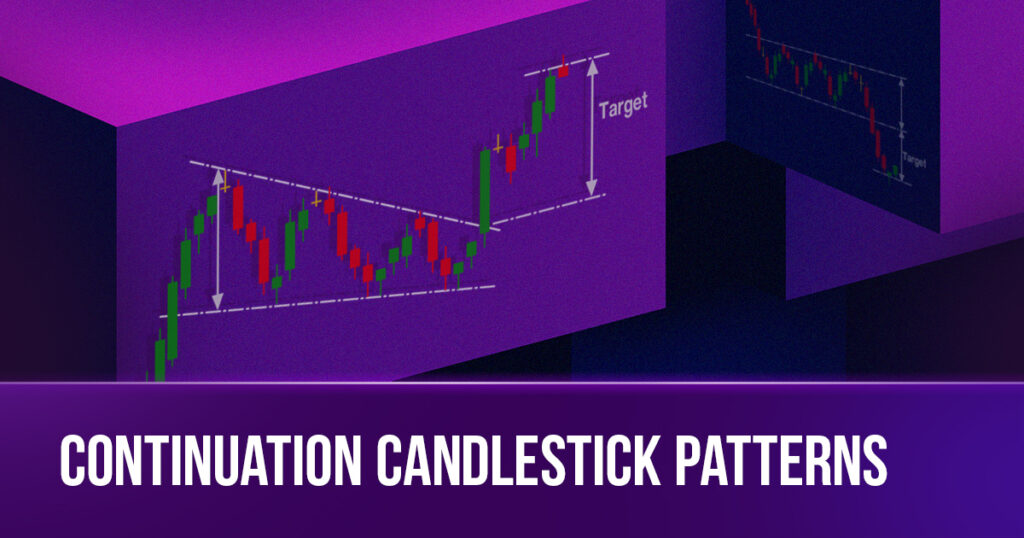
Continuation candlestick patterns are formations that suggest the continuation of an ongoing trend. Unlike reversal patterns that indicate a potential change in trend direction, continuation patterns suggest that the prevailing market trend is likely to persist. Traders use these patterns to make informed decisions about entering or exiting positions.
Benefits of Continuation Candlestick Patterns
1. Trend Confirmation: The primary benefit of continuation patterns is their ability to confirm existing trends. Traders can gain confidence in the sustainability of a trend, helping them make more accurate predictions about future price movements.
2. Entry and Exit Points: Recognizing continuation patterns provides traders with strategic entry and exit points. By understanding when a trend is likely to persist, traders can time their trades more effectively, maximizing potential profits and minimizing risks.
3. Risk Management: Continuation patterns assist in risk management by offering clear signals about the strength of an ongoing trend. Traders can adjust their risk tolerance and position sizes based on the information provided by these patterns.
Types of Continuation Candlestick Patterns
1. Upside Gap Tasuki and Downside Gap Tasuki

The Upside and Downside Tasuki Gaps are candlestick patterns consisting of three bars, frequently employed to indicate the ongoing momentum in the current trend.
| Upside Gap Tasuki | Downside Gap Tasuki | |
| Features | – Appears in the current uptrend to confirm its continuation. – Candle 1: A sizable green candlestick located within a clearly defined uptrend. – Candle 2: Another green candlestick with an opening price that displays a noticeable gap above the close of the previous bar (Candle 1). – Candle 3: A red candlestick that contributes to partially closing the gap between the first two bars (Candle 1 and Candle 2). | – Appears in the current downtrend to confirm its continuation. – Candle 1: A red candlestick observed within an existing downtrend. – Candle 2: Another red candlestick that features a gap below the close of the preceding bar, continuing the downward trend. – Candle 3: A green candlestick that concludes the sequence. It closes within the gap created by the first two bars, indicating a potential shift in sentiment. It’s important to note that the closing of the gap by the bullish candlestick may not be complete. |
| Messages | When the market closes with the third candle, it becomes a strategic buying opportunity. The gap between the first and second candles is seen as a support zone, indicating an immediate continuation of the upward trend. | When the market closes with the third candle, it represents a strategic selling opportunity. The gap between the first and second candles is viewed as a resistance zone, signaling an immediate continuation of the downward trend. |
2. Rising Three Method and Falling Three Method

An upward market trend goes by the name Rising Three Methods pattern, and a downward trend is identified as the Falling Three Methods pattern. Despite its title, the Three Methods pattern generally involves a minimum of five candlesticks, but it can also be formed with four or more candlesticks.
| Rising Three Method | Falling Three Method | |
| Features | – The first candle indicates a strong upward price trend from a previously formed trend. – The three candles in the middle of this continuation pattern typically have small bodies, lying within the range of the first candle. – The fifth candle represents a robust upward trend, and its closing price is usually higher than the closing price of the first candle. | – The first candle represents a sharp decrease in the price trend of a formed downtrend. – The three-candle sequence in the middle fits snugly within the body of the first candle. – The fifth candle symbolizes a strong downward trend, and its closing price typically falls below the closing price of the first candle. |
| Messages | – The first candle indicates buyer control, closing at a significantly high price. – The three middle candles imply buyers taking profits, causing a slight market downturn. – The fifth candle signals buyers regaining control, resulting in a notable increase. – Notably, the Rising Three Methods pattern provides more accurate predictions when the volume of the first and last candles exceeds the volume of the three middle candles. | – The first candle suggests sellers have taken control, resulting in a closure at a notably low level. – The three middle candles signal sellers taking profits, contributing to a minor upward trend in the present market. – The fifth candle, symbolizing sellers regaining control, will promptly drive the market below the closing price of the initial day. |
Conclusion:
Think of trading like conducting a musical performance. Instead of just guessing where the market will go, traders use continuation patterns as musical notes on their chart. It’s like composing a melody of smart moves and well-timed entries.
Ready to elevate your trading journey and conduct a symphony of successful trades?
Join our prop trading firm today and unlock the power of continuation patterns.