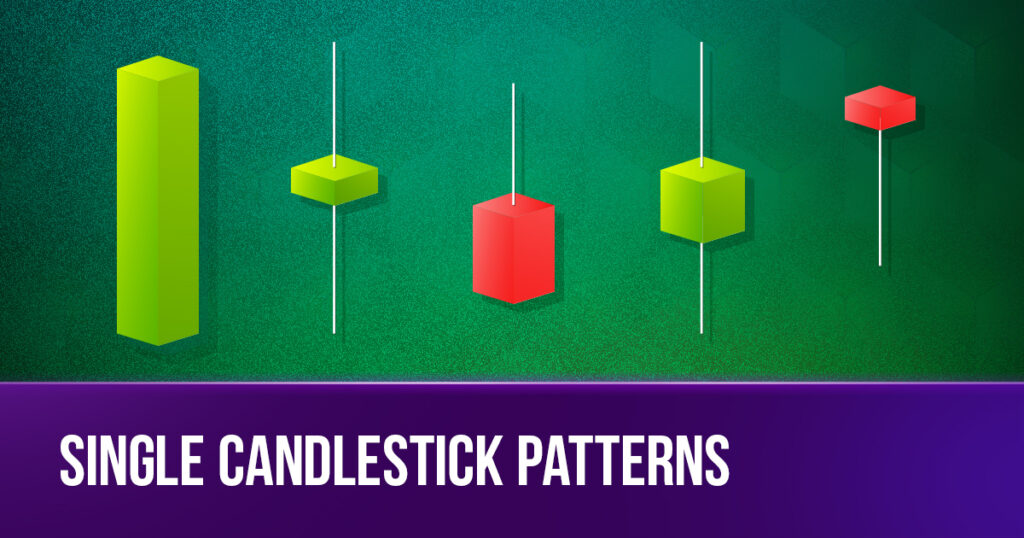
Candlestick patterns are crucial in the complex world of forex trading. We have covered the fundamental concepts of candlesticks and their patterns. Now, let’s delve into the specifics of single candlestick patterns. In this blog post, we will explore the features and meanings of the 8 most common single candlestick patterns, empowering you to navigate the financial markets with confidence.
1. Standard Candlestick
- Features: It is characterized by a substantial body, significantly longer than an average candlestick, with relatively short shadows.
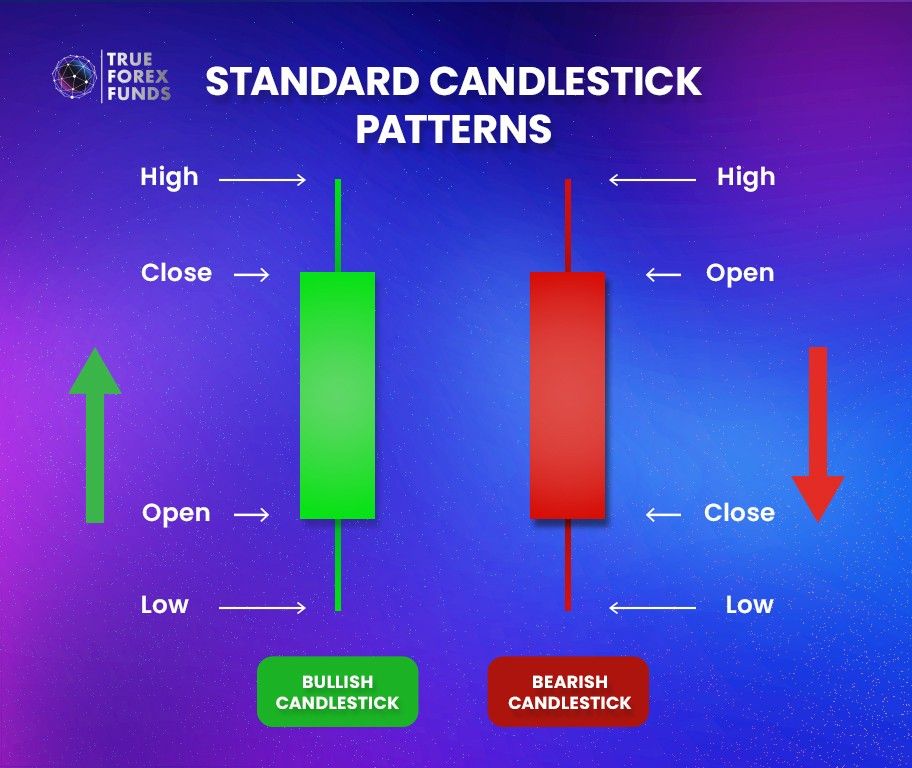
- Messages: This unique appearance signifies a straightforward message – it indicates a continuation of the prevailing underlying trend.
2. Marubozu Candlestick

In Japanese, “Marubo” means a large block or shape. A Bullish Marubozu is a rising candle (green color), while a Bearish Marubozu is a falling candle (red color).
- Features: The body of the Marubozu candle is large, with almost no candle shadows. Both its opening and closing prices approximately align with either the highest or lowest price of the trading session.
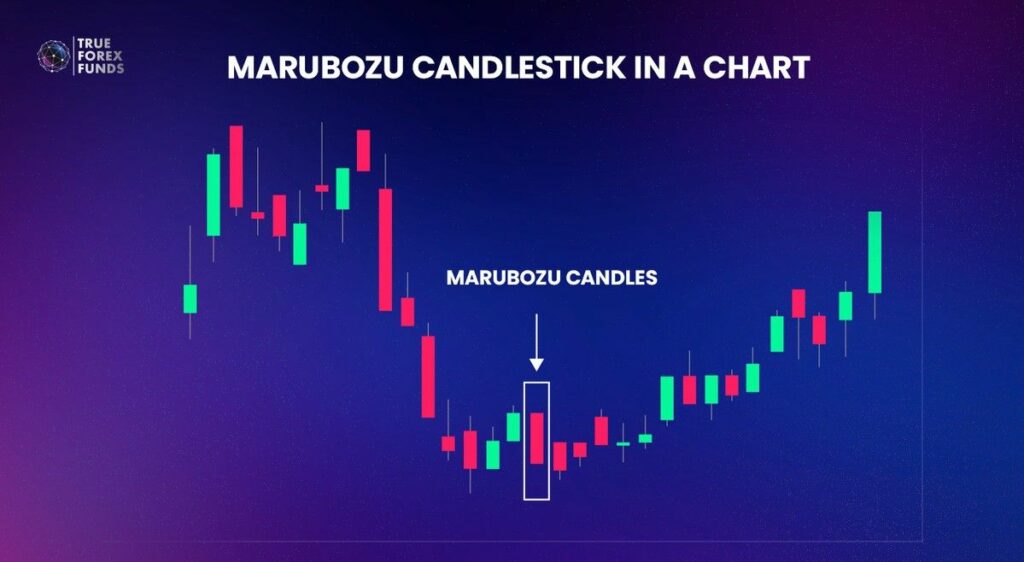
- Messages: A green Marubozu candle signifies a market scenario dominated by buyers, facilitating a smoother ascent in prices. Conversely, a red Marubozu candle denotes seller dominance, prompting a more decisive descent in prices.
3. Spinning Top Candlestick
- Features: Spinning Tops is a single candlestick that have a moderately small body with long shadows extending well beyond the body.
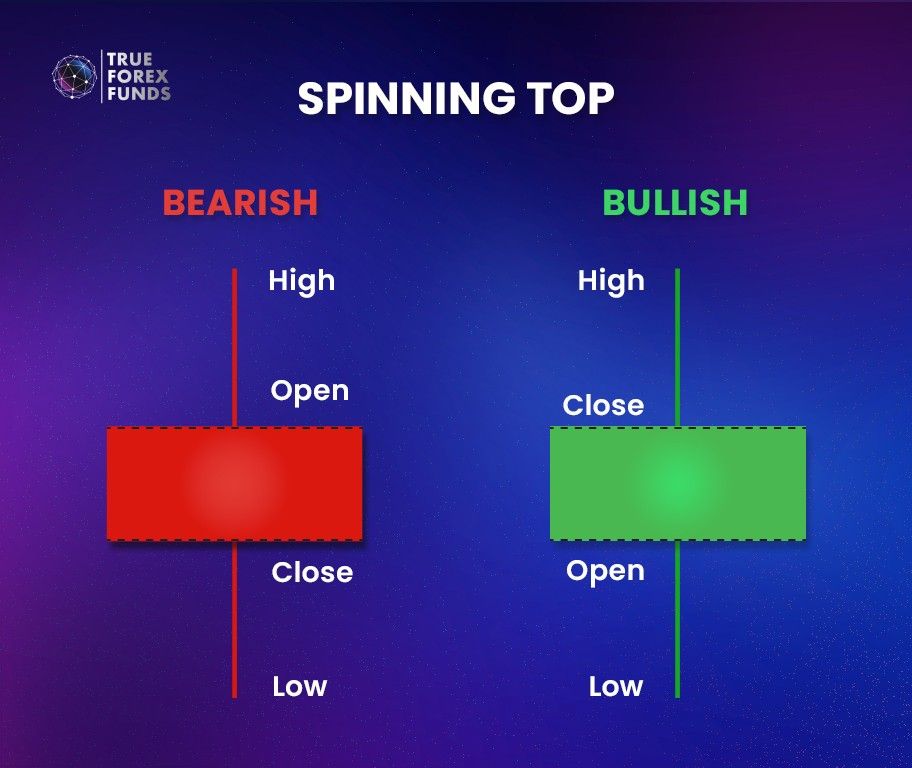
- Messages: The long shadows indicate significant price volatility during the trading session, while the opening and closing prices are relatively close. Spinning Top shows a fierce battle between buyers and sellers, resulting in a tie. If the market is on an uptrend and Spinning Tops appear, it suggests that buyers are becoming hesitant, possibly signaling a potential market reversal.
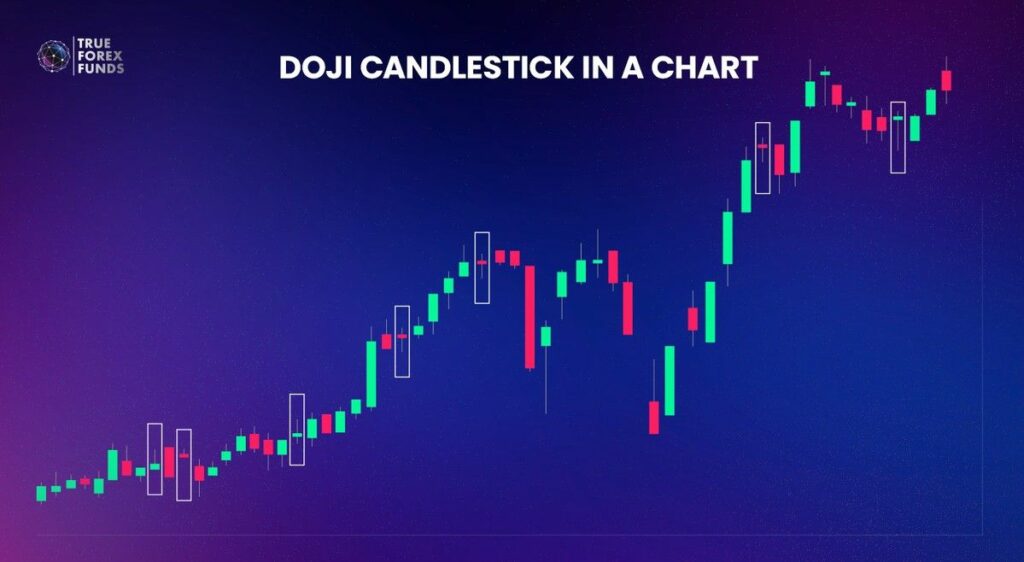
4. Doji Candlestick
A “Doji” in Japanese translates to “unchanged,” meaning the opening and closing prices are nearly unchanged. A Doji candlestick appears with a very small (smaller than the spinning top one) or virtually non-existent body, accompanied by long shadows extending beyond it.
There are three key types of Doji patterns: Dragonfly Doji, Gravestone Doji and Long Legged Doji.
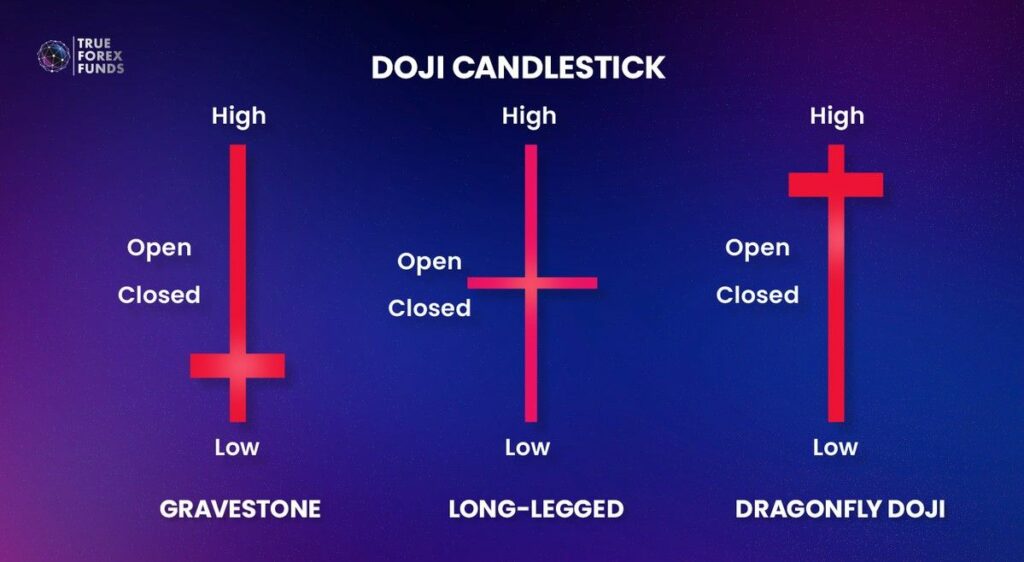
Gravestone Doji:
- Features: This pattern looks like a gravestone, with a small body, a long upper shadow, and no lower shadow. It usually emerges at the peak of an uptrend.
- Message: Gravestone Doji suggests a stagnant market with minimal trading activity, where the opening, closing, and lowest prices are nearly the same. When a Gravestone Doji appears, it signals increased selling pressure, but traders should wait for additional confirmation. If the next candlestick breaks through resistance, the market is likely to reverse.
Dragonfly Doji:
- Features: It resembles a dragonfly with wide wings and a long tail, this pattern features a small body and a long lower shadow.
- Message: Dragonfly Doji indicates a quiet market where the opening, closing, and highest prices are nearly equal. The long lower shadow suggests a balance between buying and selling pressure. Therefore, it might be a signal of potential upward market reversal.
Long Legged Doji:
- Features: Characterized by a slender body and very long upper and lower shadows.
- Messages: Long-Legged Doji reflects market indecision, with no clear direction. Consequently, traders might be careful to watch for further signals in subsequent candlesticks.
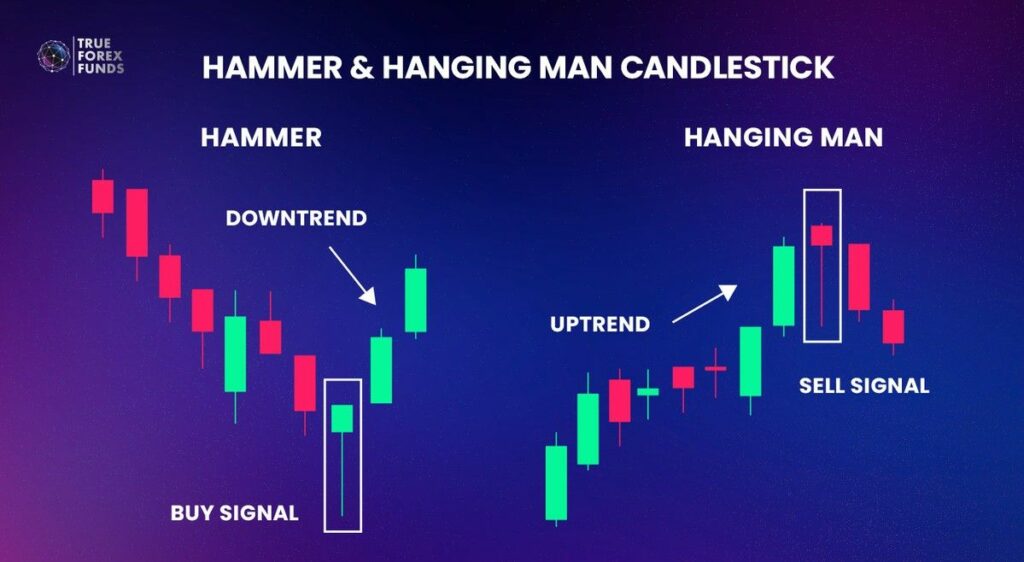
5. & 6. Hammer and Hanging Man: Powerful Single Candlesticks
We put this in a table since there are some similarities between those single candlestick patterns:
| Hammer | Hanging Man | |
| Features: | They both contain the lower shadow at least twice as long as its body and the upper shadow may be nonexistent or very short. However, the difference is where they appear. | |
| Hammer appears in a downward trend. | While Hanging Man appears in an upward trend. | |
| Messages: | It may signal that the market has oversold and is likely to move upwards. | It may signal that the market is at the peak of an uptrend and is likely to move downwards. |
| Green Hammer: means the closing price equals the highest price, indicating a strong potential for a stock price increase. Red Hammer: means the opening price equals the highest price, suggesting a mild increase. | Green Hanging Man: means the closing price equals the highest price, indicating a slight decline. Red Hanging Man: means the opening price equals the highest price, signaling an impending sharp price drop. | |
7. & 8. Inverted Hammer and Shooting Star Candlesticks
In contrast to the previous candlestick pairs, the inverted hammer and shooting star have notably long upper shadows and short lower shadows.
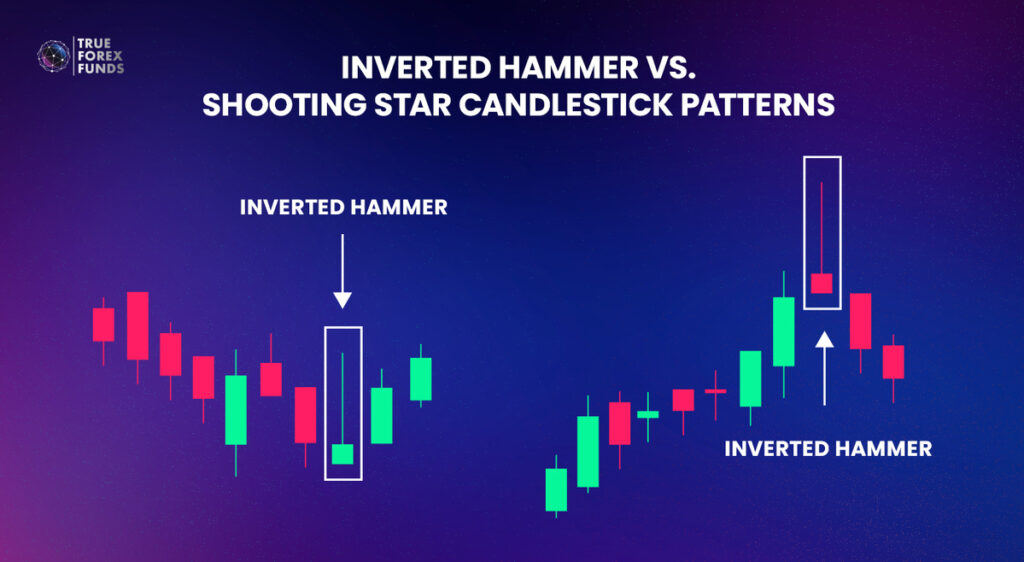
Yet, they are also differentiated by their positions:
| Inverted Hammer | Shooting Star | |
| Features: | Upper shadows at least twice as long as the body, and very short or nonexistent lower shadows. | |
| Inverted Hammer appears in a downward trend. | While Shooting Star appears in an upward trend. | |
| Messages: | They may signal a potential market reversal similar to the Hammer and Hanging Man but more certain. | |
Single Candlestick Patterns Navigate Your Market Sentiments
Mastering single candlestick patterns is essential for anyone looking to excel in financial markets. However, comprehending these patterns can be quite demanding, requiring a thorough understanding and practical experience. Without this expertise, you may expose yourself to significant risks.
To facilitate your learning journey,
True Forex Funds offers balance options of up to $400,000, starting at just €89. This opportunity allows you to explore and learn from your mistakes without incurring substantial costs, making it easier to grasp these critical patterns.