Understanding candlestick patterns is a vital aspect of your forex trading journey. It plays a significant role in determining your ability to analyze the market and long-term success. But, let’s take a step back for a moment. What is a candlestick in forex trading and what does it mean?
What is A Candlestick in Forex Trading?
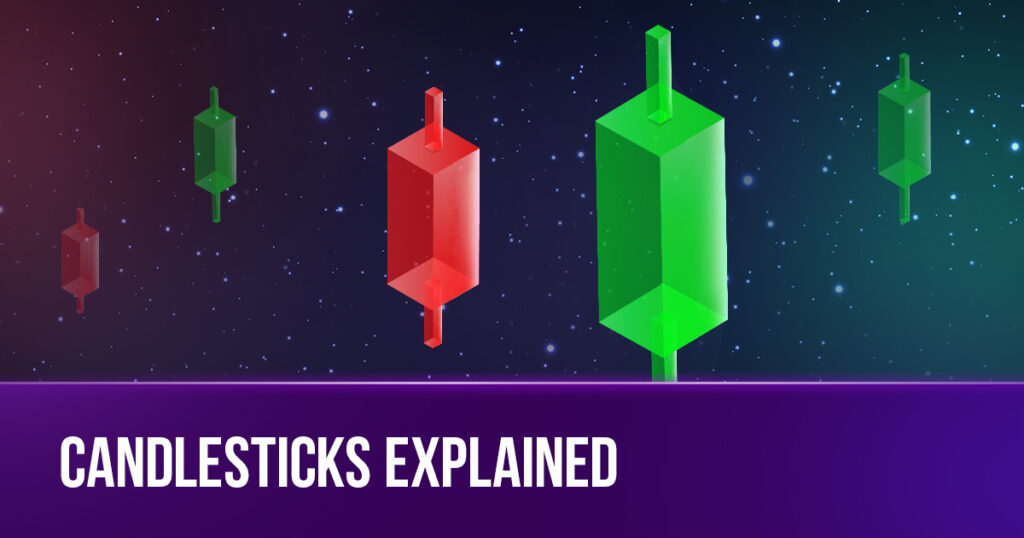
A candlestick in trading is a visual representation of price movements for a specific time period. Each of them delivers four key pieces of information: opening, closing, highest, and lowest prices.
Multiple candlesticks appearing in the patterns are able to identify the trend in price movements, helping forex traders to make decisions about when to sell and buy currencies. In terms of forex trading, it depicts the fluctuations in a currency pair’s exchange rate in the past and the present.
The Origins of Candlesticks
The father of the candlesticks was a Japanese rice trader named Munehisa Homma back in the 18th century. At that time, this method helped them to analyze the movements of rice prices, and identify the price for futures contracts.
The credit for bringing candlestick patterns into Western financial markets goes to Steve Nison, who published the book “Japanese Candlestick Charting Techniques” in 1991. Since then, these patterns have gained widespread popularity among traders worldwide.
Two Components of A Candlestick
Typically, a standard one will have all the following parts:
- Real Body: The real body of the candle represents the range of price fluctuation between the opening price and the closing price within a specific time period, where:
- Opening Price: the starting price in a trading session.
- Closing Price: the final price, ending the trading session.
- Shadows: The shadows represent the highest and lowest prices within the session.
- Upper Shadow: the peak of the highest price in the trading session.
- Lower Shadow: the bottom of the lowest price in the trading session.
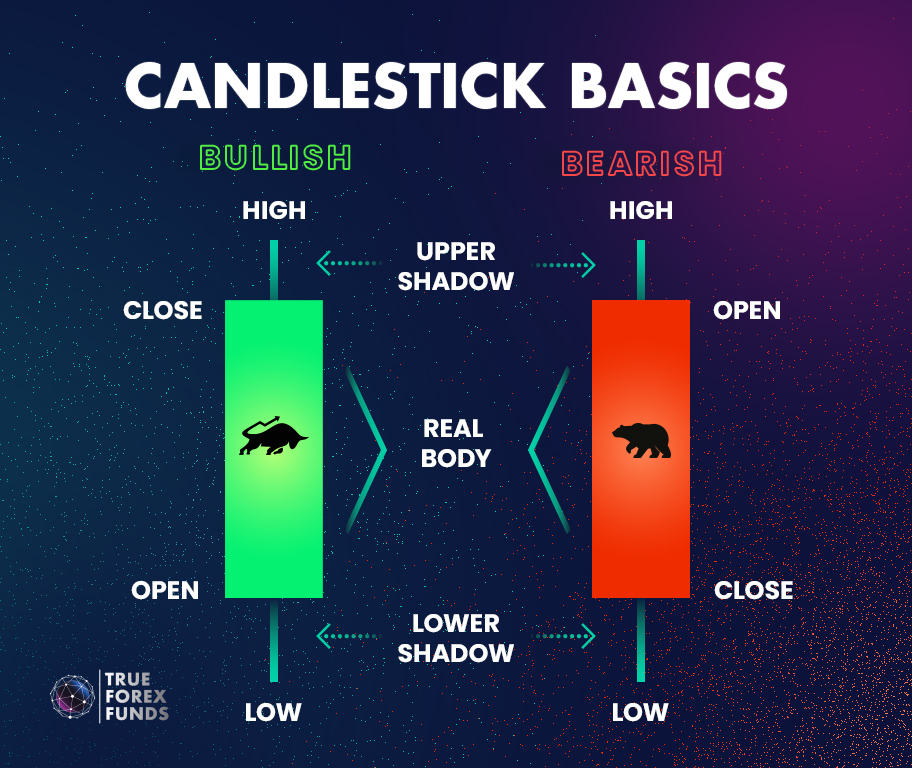
In addition, Japanese candlesticks are represented in two colors – green and red. Each color has a different meaning, specifically as follows:
- Green Candlestick (Bullish Candlestick): The opening price is lower than the closing price, indicating a price increase.
- Red Candlestick (Bearish Candlestick): The opening price is higher than the closing price, indicating a price decrease.
How to Read A Candlestick
For the quickest understanding of how to read candlesticks, you can watch the video below to learn how to read candlesticks:
The Idea Behind A Candlestick
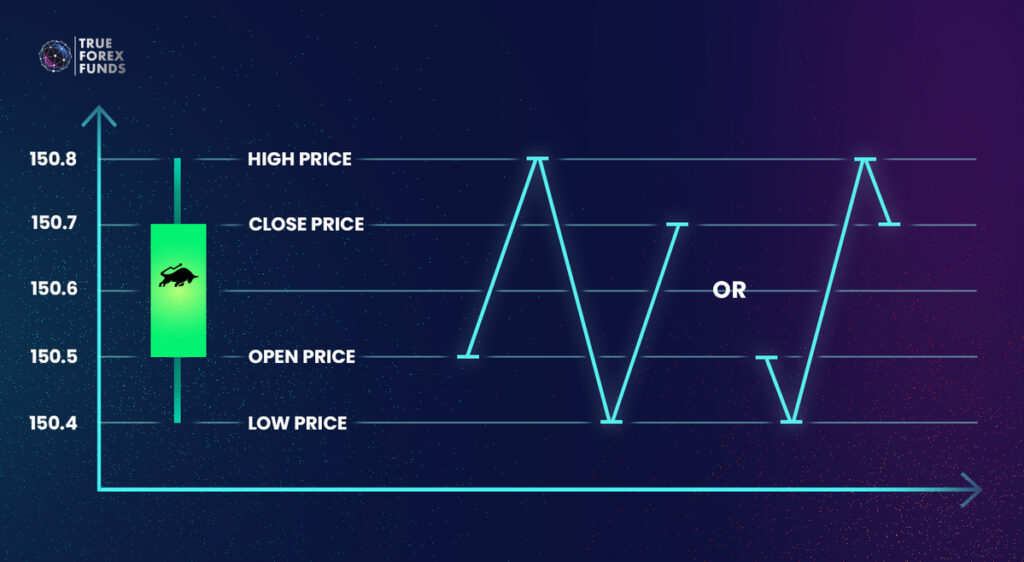
A candlestick is created to depict the price fluctuations within a specific time frame. For example, let’s consider one for the USD/JPY currency pair in a 30-minute time frame.
- Opening Price: 150.50 at the candlestick’s start.
- High Price: 150.80, as indicated by the upper shadow.
- Low Price: 150.40, as shown by the lower shadow.
- Closing Price: 150.70, marking the candlestick’s end.
- Color: Green.
Therefore, we can understand the exchange rate movement within a 30-minute period like this:
How to Optimize Candlesticks in Forex Trading
A single candlestick only provides information about price values within a specific time frame. However, when these candlesticks form patterns, they offer valuable insights. Think of them as pieces of a puzzle; when they come together, they create patterns that reveal crucial hints about market trends. To begin, it’s a good idea to learn about the patterns and their various types.