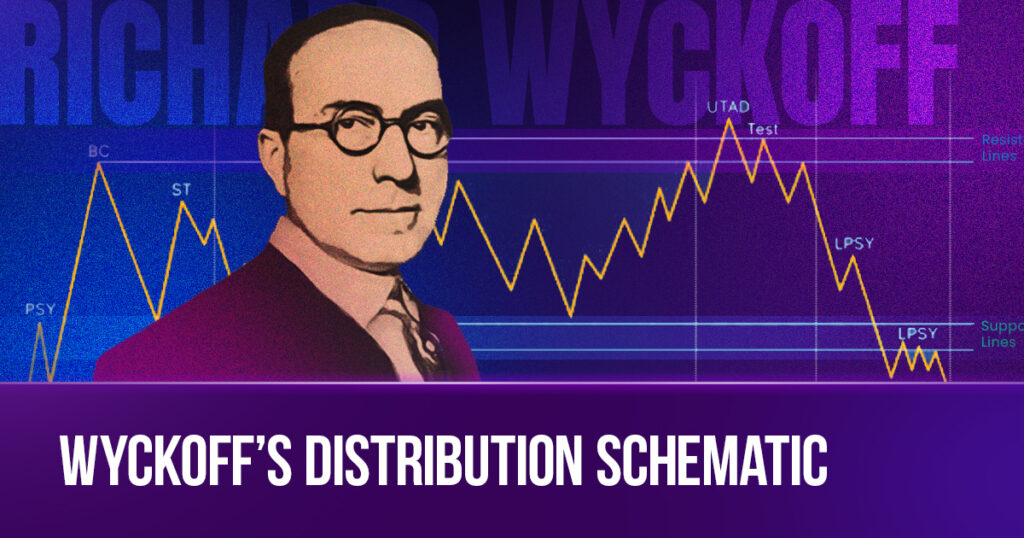
Wyckoff carefully outlined a market cycle with four stages: accumulation, markup, distribution, and markdown. During accumulation and distribution, major market players strategically establish their positions within specific price ranges. To assist traders in seizing opportunities early on, Wyckoff created schematics. This blog will specifically delve into Wyckoff’s Distribution Schematics, providing a detailed guide to the various phases and events within.
Wyckoff’s Distribution Schematic
Similar to Accumulation, the concept of Cause and Effect, which is a principle in the Wyckoff method, still applies. The longer the distribution cycle lasts, the more significant its impact on pushing prices downward. During this phase, market makers may manipulate prices to gather enough short positions, contributing to the overall downward trend in prices.
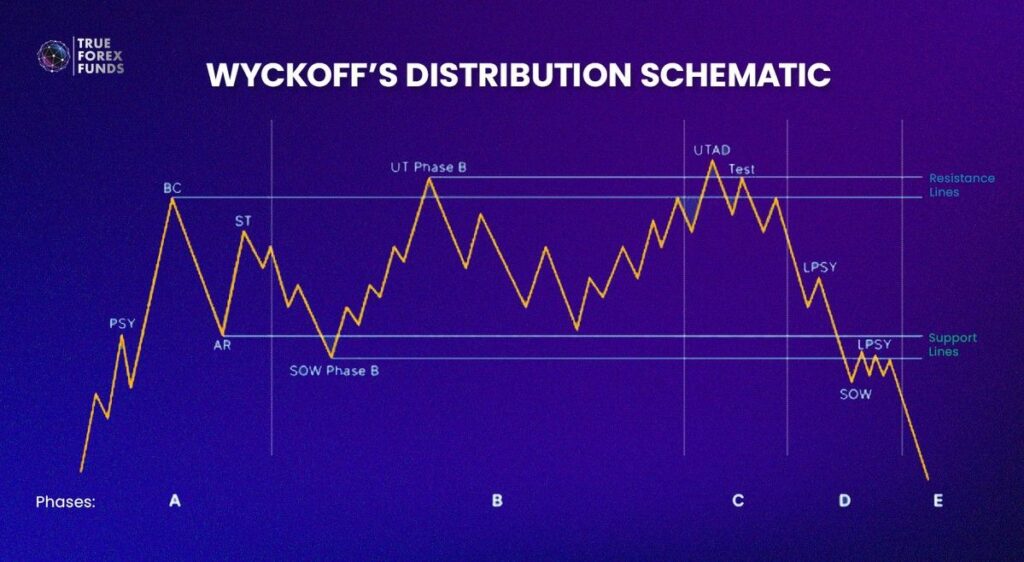
Phase A: The End of An Old Uptrend
Phase A in Wyckoff’s distribution schematic 1 marks the conclusion of an uptrend, signaling a pause in momentum. The shift occurs as demand, which had been surpassing supply for an extended period, changes. This phase encompasses the following events:
1. Preliminary Supply (PSY):
- What it is: The initial resistance after the uptrend, indicating market makers closing long positions.
- Why it matters: In PSY, volume can increase, and spreads widen as this first sign of resistance emerges.
2. Buying Climax (BC):
- What it is: The peak of public buying power, often triggered by significant news events.
- Why it matters: BC represents the moment institutional short positions are filled, signaling the climax of buying activity.
3. Automatic Reaction (AR):
- What it is: Establishes the lower boundary of the trading range for the upcoming distribution cycle, indicating stronger supply caused by the Buying Climax.
- Why it matters: AR defines the extent of the market reaction following the Buying Climax, highlighting increased selling pressure.
4. Secondary Test (ST):
- What it is: A test of the already-established resistance, showing that supply now outweighs demand.
- Why it matters: Though it may surpass the previous swing high, it should quickly return inside the trading range, underlining the dominance of supply.
Phase A sets the stage for Wyckoff’s Distribution cycle, with clear indications of changing market dynamics and the emergence of supply dominance.
Phase B: The Start of New Downtrend
In Phase B, the market is getting ready for a downward trend. The folks who control the market (market makers) are working to use up any remaining interest from buyers and build up their own positions to benefit from falling prices. Two main events happen:
- Sign of Weakness (SOW): This marks the lower limit of the expected price range. It shows that there’s going to be more selling than buying soon. So, When you see more trading activity and wider price differences during this time, it’s a sign that sellers are gaining control.
- Upthrust in Phase B (UT Phase B): This defines the upper limit of the expected price range. It involves a move that might trick buyers and make sellers nervous. Market makers are playing a strategic game to attract buyers while also scaring sellers into giving up their positions.
Phase B is when the big players set the market up for prices to go down. They create clear boundaries for where they expect prices to move, making trick moves for regular buyers and sellers.
Phase C: The Start of New Downtrend
In Phase B, there’s a crucial event in the distribution plan, which called Upthrust After Distribution (UTAD):
- The Upthrust After Distribution (UTAD) acts like a deceptive bull trap when the price surpasses recent highs. However, considering all the distribution phases, it gains more accuracy. The price quickly seizes most of the buying interest on the upside but promptly retreats back into the established trading range.
- The UTAD Test follows, examining both the Spring and the previously defined resistance lines. This test provides a clear confirmation of the forthcoming downtrend and signals a shift in the balance of supply and demand.
Phase D: The Spot of Validation
Distribution Phase D is where the distribution cycle gains validation with more evident downward price movements. Last Points of Supply (LPSYs) present opportunities to initiate short positions within the trading range or after a more pronounced Sign of Weakness.
- Last Point of Supply (LPSY): The LPSY marks a potential entry point for extended short positions. It occurs as a swing point following a minor rally, allowing for improved Risk-Reward ratios by entering at higher prices.
- Sign of Weakness Phase D (SOW): The SOW in Phase D acts as a confirmation for the distribution. Clearer price movements unfold, and breaking key support lines signifies high-probability setups for short positions.
Phase E: Final Stage of Distribution
In Phase E, the downtrend takes hold, and the price breaks free from the trading range of the distribution cycle. This phase offers various trading opportunities, especially for retracement entries. The markdown phase will conclude with either a Re-Distribution, Accumulation, or consolidation.
Redistribution
In a falling market, Re-distribution occurs and briefly interrupts the downward trend. The initiation of a Wyckoff redistribution schematic is the same as the beginning of an Accumulation cycle.
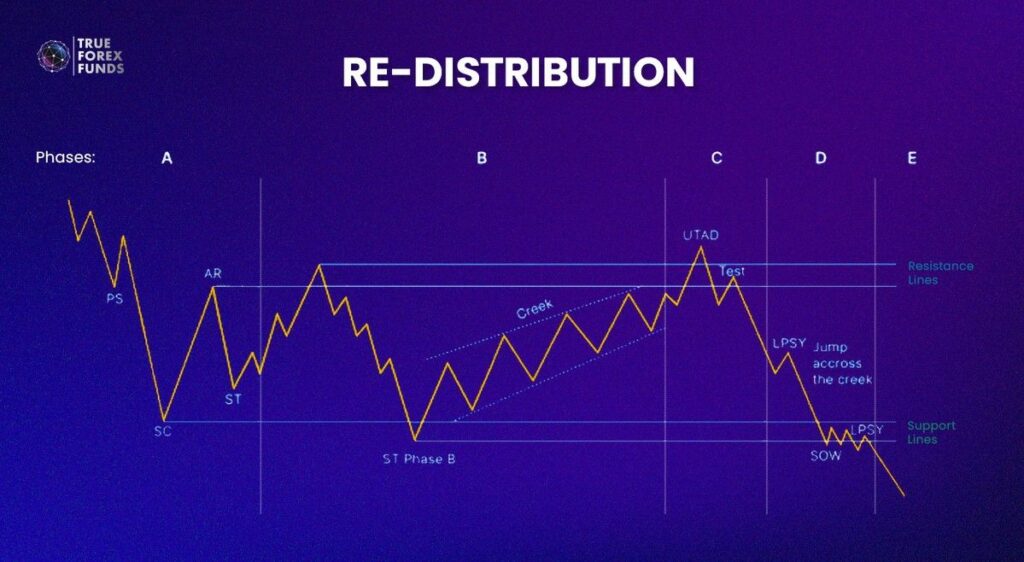
Reaccumulation and Redistribution are often confused, with Reaccumulation being mistaken for Distribution and Redistribution for Accumulation. Yet, it is noticeable that Redistribution is similar to Distribution, but instead of concluding an upward move, it extends a longer-term downward trend. Check out the Wyckoff accumulation for more details on what happens during these events.
Cautions When Identify Wyckoff Schematics
It is undeniable that Wyckoff Schematics is complicated by intertwining with different schematics and phases. Therefore, you should be noted to:
- Confirmation with Fundamental Analysis: Wyckoff cycles should not solely rely on event labels; it’s crucial to support them with a fundamental market analysis. Confirmations can come from cot data, seasonalities, or other longer-term indicators.
- Beware of Time Frame Misinterpretation: Avoid the mistake of identifying Accumulations and Distributions in lower time frames. While it may seem convenient on a 5-minute chart, genuine Accumulation occurs in much higher time frames.
- Patience for Unfolding: Wyckoff cycles take time to unfold. Exercise patience and wait for events to occur, fully validating the cycle. Impulsive decisions based on incomplete information can lead to poor trading outcomes.
Unlock the power of Wyckoff’s Schematic and level up your trading skills!
Register with our prop firm today for a hands-on opportunity to practice and apply Wyckoff’s insights in a real trading environment.