One of the methods of technical analysis that traders use to aim to secure profitable trades is chart patterns. The flag pattern is a chart pattern that occurs very often and delivers a high degree of accuracy. In this article, you will learn all you require to use the flag pattern profitably as you aim to qualify to become a True Forex Funds funded trader.
Start funded trading
Get fundedFlag patterns explained
A flag is a continuation chart pattern that draws its name from how it looks. It represents an area of price consolidation after a trend move. It takes the shape of a flag when the highs and lows of the price bars/candles within the consolidation area are joined with independent trend lines.
So how can you identify a flag pattern? A flag pattern has three components:
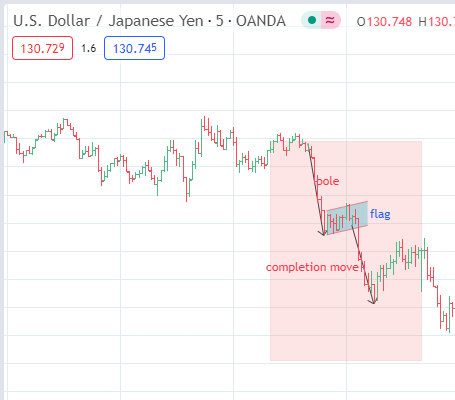
- The initial trend move (the flag’s pole)
- The consolidation area (the flag itself)
- The continuation move (the breakout move from the flag)
A completed flag should look like a flag flying at half-mast on a pole.
Types of flag patterns
There are two types of flag patterns.
- The bull flag, which results in an upside move and should be traded using long positions.
- The bear flag, which is the opposite of a bull flag. The bear flag should be traded with short positions to profit from the expected downward continuation in price.
You can also look at the patterns as inverted forms of each other. For instance, a bear flag is an inverted form of the bull flag. Turn the bull flag upside down, using the starting point of the initial move as the fulcrum of this movement, and you have the bear flag.
What do flag patterns indicate
Flag patterns are continuation patterns. They are not reversal patterns and therefore are not used for trading a trend change. Indeed, flag patterns are found within the minor trends (i.e., short-term trends). They are commonly found on charts, especially the ones with short time frames.
Here is a snapshot of the two variations of the flag pattern (bull flag and bear flag) showing the three parts of the pattern’s price action.
As a trader, your goal should be to identify (a) and (b), and use your trade entry to catch the continuation move to profit from it. So your job is to identify the initial trend move and the consolidation area.
What are patterns made of?
- The initial trend move (the pole)
The flag is started by an initial move (uptrend or downtrend) and this move can occur on any of the time frames. You are more likely to see these patterns in time frames that reflect the minor trend (1 hour, 15-minute and 5-minute charts).
- Flag consolidation area
Two parallel trendlines (or a channel) form the consolidation area. These lines independently connect the highs and lows of the price bars/candles such that the trendlines are parallel to each other. This feature is what distinguishes the flag pattern from the pennant pattern, whose trendlines are convergent even though they have the same outcome. As a rule, the direction of the trendlines is a tilt to the direction that is opposite to the initial move (pole), or is horizontal in orientation.
- The completion move
Also known as the measured move, this is a breakout move from the flag consolidation area, usually in the direction of the initial trend move. This is the move that the trader aims to catch using a trade entry in the direction of the expected breakout move. To be able to trade this, the trader must understand the principle of the breakout and how to trade the breakout.
As a rule, the extent of the breakout move is usually the same distance as the initial trend move. This helps the trader set a Take Profit target to lock in any profits made.
Become a funded trader
Get fundedThe breakout strategy
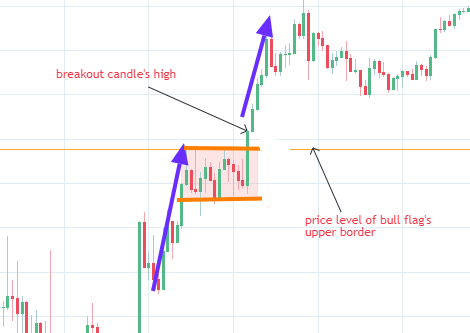
The aim of trading the flag patterns is to catch the third leg of the pattern, which is the completion point. This means trading the break of the price action from the bull flag’s upper border or the bear flag’s lower border. This requires an understanding of the breakout and what each of the candles or bars that form the breakout bars/candles are saying.
It does not matter whether you are trading a crypto bull flag or a forex bull flag or if you want to go short after seeing a crypto bear flag or forex bear flag pattern. The principle of the breakout works in both directions.
A breakout occurs when the reference candle closes above the bull flag’s upper border or below the bear flag’s lower border. However, this does not mean that you just buy or sell whenever these situations occur. You must apply confirmation filters to avoid becoming a victim of a fakeout move.
Every breakout has two types of confirmation filters: the time filter and the price filter.
- Time filter: A time filter is candle/bar-based, meaning there must be at least two candles that end with closing prices above the bull flag’s upper border or below the bear flag’s lower border for a breakout to be confirmed. This is a time-based confirmation because each bar/candle represents the price action for a period, usually represented on the chart’s time frame. The time filter is also known as the two-day or two-candle rule.
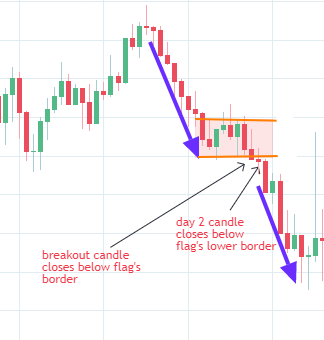
Here, we can see that there was a double candle closing penetration of the bear flag’s lower border, fulfilling the time filter parameters for a breakout. The bear flag went on to attain full completion of the measured move.
- Price filter: This filter requires only one candle/bar, and states that the breakout bar must close above the bull flag’s upper border or the bear flag’s lower border by a 3% price penetration. Some authorities say a 1% penetration if you are dealing with short time frames.
What is price penetration?
A price penetration filter means a price threshold that the breakout candle must exceed for the break to be valid. This price filter is a percentage move above the bull flag’s upper border or the bear flag’s lower border. The percentage is calculated as follows:
- the distance between the flag’s border (acting as a resistance or support) and the candle’s closing price, divided by the length of the candle and expressed as a percentage.
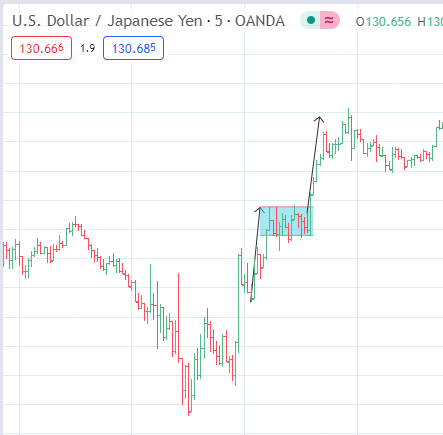
Here is an example.
- The breakout candle has a low of 132.95 and a high of 133.25, which is a length of 30 pips.
- The bull flag’s upper border is at a price of 133.15. The distance between this price mark and the reference candle’s high is 10 pips.
So what is the price penetration percentage? This is calculated as:
(10/30) X 100 = 33%.
This candle exceeded the price penetration threshold for a breakout confirmation, and the pattern went on to completion as expected.
Bull flag vs bear flag: the differences
The difference between the bull flag and the bear flag is fairly simple. They are mirror images of themselves. The bull flag is a bullish chart pattern, where you would see a price rise (sharply, and regardless of the time frame), followed by consolidation and then the break to continue bullish.
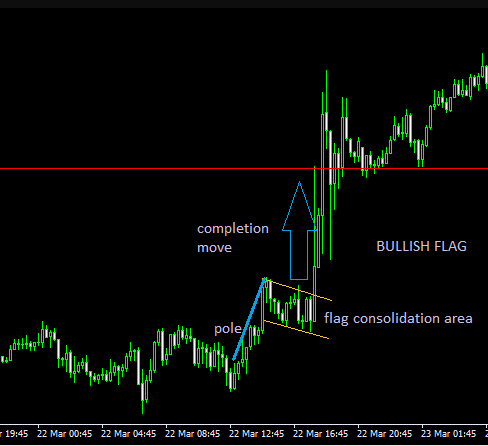
What does a bull flag look like?
The snapshot below shows what a bull flag looks like.
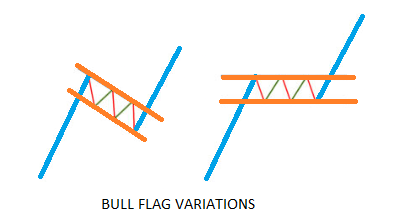
There are two variations to the bull flag. The first is commoner and features a flag consolidation area that tilts downwards against the initial trend that forms the pole. The second variation is the horizontally-oriented flag.
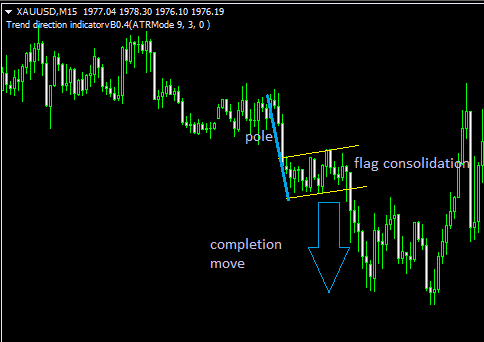
What does a bear flag look like?
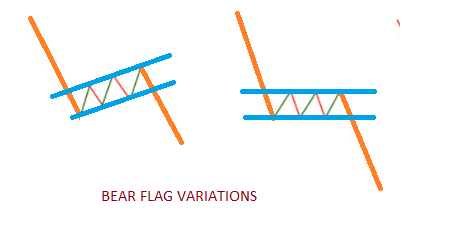
Just like with the bull flag, two variations of the bearish flag exist. The first occurs more commonly and features a flag consolidation area that tilts upwards against the initial trend that forms the pole. The second variation is the horizontally-oriented flag.
Flags as market direction indicators
The flag pattern can be likened to a runner who has to pause and catch his breath before continuing to the finish line. At the moment of the pause, there is contention between the bulls and bears, and eventually, the market segment pushing the initial trend wins the battle and continues to push the price to the finish line.
What does the bull flag indicate?
Typically, the volume pattern within the flag’s consolidation area indicates the power of the market players. It indicates a situation where buyers are in control and are pushing the price but have to contend with contrarian forces midway into the move before they have their way. When the price is in consolidation, the buyers tend to have more volume than the sellers. This signifies an accumulation of buying volume, eventually sending the price out of the flag and toward the finish line.
What does the bear flag indicate?
It indicates a situation where sellers dominate the market action. Sellers force the price lower but must overcome a weak attempt by the bulls to resist the downward move. Again, volumes are higher during the downward oscillation from the upper flag border to the lower border, indicating that selling volumes accumulate and overpower the buying interest. Eventually, the buyers are overwhelmed and capitulate under selling pressure, ending with a downward breakout to the finish line.
How reliable is a flag pattern?
The flag patterns are highly reliable and rarely result in invalidations. Therefore, they should form part of the trading arsenal of any trader wanting to pass the
Flag patterns are one type of price pattern found on the price charts of all assets. They are highly accurate in predicting the future price direction of the asset. The challenge here is for traders to identify and know how to trade the pattern. Hopefully, this article has shed some light on this and will help aspiring traders to become successful True Forex Funds evaluations and become a funded trader.
How to trade the bull flag
Trading the bullish flag can be done in two ways:
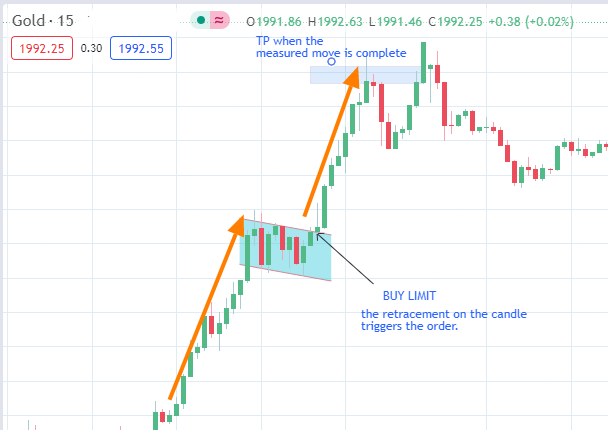
- You can use a Buy Limit order, setting the price corresponding to the broken upper border of the bull flag as the entry price. This must be done after the breakout has occurred, and a high penetration level puts a considerable distance between the breakout candle’s closing price and the bull flag’s upper border. The principle behind this trading format is that sometimes, the price wants to return to where it came from but is usually rejected due to the role reversal of the broken flag border. In other words, the upper border of the flag, being a previous resistance, becomes a new support once it is broken. The retracing price action triggers the order.
- You can use a Market Buy order if the confirmation of the breakout was done using the two-day rule, and the closing price of the 2nd candle is not far from the flag’s broken border.
How to trade the bear flag
Trading the bullish flag can be done in two ways:
- You can use a Sell Limit order, setting the price that corresponds to the broken lower border of the bull flag as the entry price. Again, this must be done after the breakout has occurred, if there was a high downside penetration below the bear flag’s upper border.
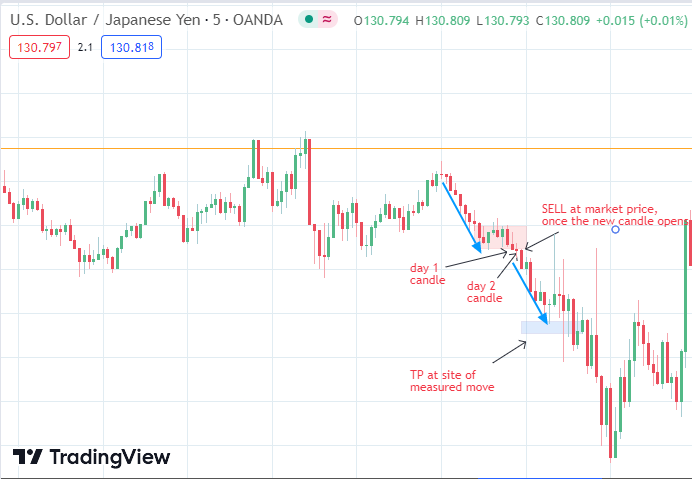
- You can also sell at market price if there is a double candle filter and the closing price of the 2nd candle (day 2 candle) is not too far from the flag’s lower border, now acting as a role-reversed resistance.
Conclusion
Flag patterns are one type of price pattern found on the price charts of all assets. They are highly accurate in predicting the future price direction of the asset. The challenge here is for traders to identify and know how to trade the pattern. Hopefully, this article has shed some light on this and will help aspiring traders to become successful traders at prop firms such as True Forex Funds.
Start trading with our capital
Get fundedFrequently Asked Questions
A bull flag is a bullish continuation pattern. It indicates that the price action will continue to rise in continuation of the initial uptrend move.
A bear flag is a bearish continuation pattern. It indicates that the price action will continue downward, being the direction of the initial move (the pole).
The trade entry should capture the price action break from the upper border of the flag consolidation area. Therefore, the stop loss in a bullish flag pattern is placed just below the flag’s upper border.
The completion move (measured move) is the same distance as the pole. So measure the height of the pole in pips (or points if you trade commodities), and extrapolate this distance from the bull flag’s upper border upwards. Set the Take Profit (TP) once you have got the right point.
The trade entry aims to capture the price action break from the flag consolidation area’s lower border. Therefore, the stop loss in a bearish flag pattern is set just above the flag’s lower border.
The completion move (measured move) is the same distance as the pole. Measure the pole’s height in pips (or points if you trade commodities), and extend this distance downwards, starting from the bear flag’s lower border. Set the Take Profit (TP) once you have got the right point.
The size of the flag pattern matters a lot and will decide the eventual outcome and the time it takes to achieve this outcome. Size can be looked at from the standpoint of the pole’s length or the size of the consolidation area. The pole’s size (i.e. length) determines how long the eventual breakout move will be. The size of the flag’s consolidation area will determine the time it takes before the price eventually breaks out from this area.
Failure to break the respective borders to initiate the breakout move causes the pattern to fail and invalidates the signal. That is why it is essential to wait for the fulfillment of the breakout conditions before setting your trade signal. However, failures of the bear and bull flags are rare.
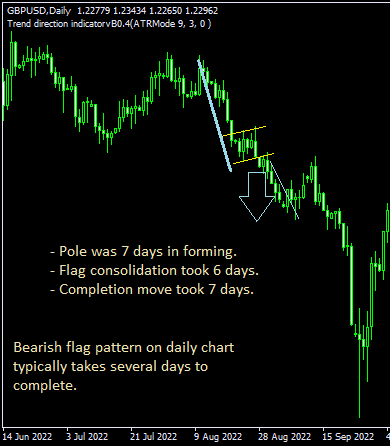
This will depend on the time frame in which the pattern is identified. A bear flag detected on a 5-minute or 15-minute chart typically resolves within a few hours. In contrast, a bear flag seen on a 4-hour or daily chart may take some days to resolve fully.