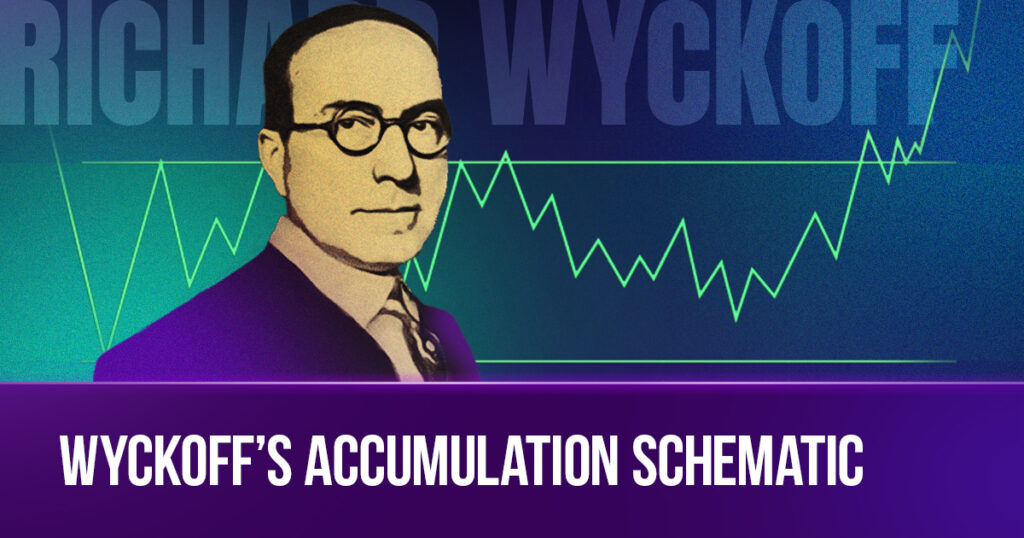
Wyckoff’s Theory stands as a blueprint for success in forex trading. With meticulous attention to detail, Wyckoff identified and defined a market cycle of four phases: accumulation, markup, distribution, and markdown. In accumulation and distribution, big players in the market are setting up their positions in certain price ranges. So, Wyckoff made schematics to help traders catch opportunities before they’re gone. This blog will focus on Wyckoff’s Accumulation Schematics, giving a comprehensive guide to the different phases and events involved.
The Logic Behind Wyckoff’s Schematic
Before we dive into the details, Wyckoff wants us to grasp two key terms:
- Trading Range: where the last trend hit its highest and lowest points. It’s a zone where supply and demand are in balance or equilibrium.
- Consolidation: A compressed price range where the price stays within a certain range for a while.
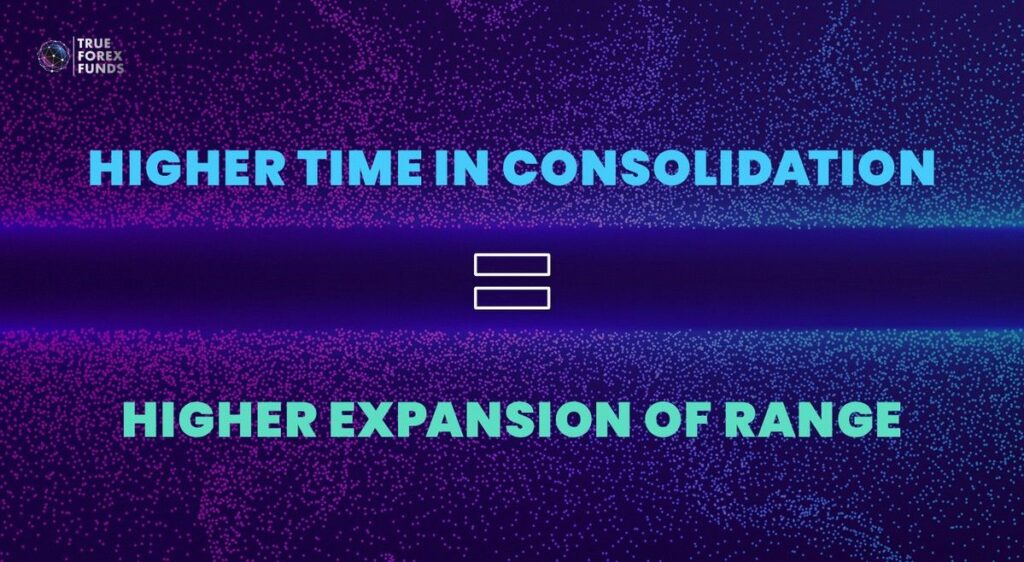
The big players in the market use these trading ranges and consolidations to build their positions. Here’s the rule: the longer the price stays in consolidation, the bigger the jump when it finally breaks free from that range.
In Wyckoff’s framework, he categorized consolidations based on their outcomes. When a consolidation wraps up with a markup and expansion, he labels it as an accumulation. If a consolidation concludes with a downward markdown and expansion, it is distribution.
His schematics, born from a detailed analysis of consolidations, provide a concise toolset for predicting future directional movements.
Wyckoff’s Accumulation Schematic
The Wyckoff’s Accumulation is a market event where big institutions, also known as the Composite Man, strategically accumulate significant long positions over a period. It can also manifest during an uptrend as a Re-Accumulation to sustain the bullish trend post-consolidation. The basic rule is the more extended the consolidation, the more impact it has on the upcoming bullish market. During consolidation, big institutions use Wyckoff’s Accumulation schematic to slowly accumulate positions over time. They create an environment where buyers and sellers are deceived, allowing institutions to accumulate large positions. This manipulation continues until institutions have gathered their desired positions. Wyckoff’s Accumulation involves 5 phases, each with distinct events.
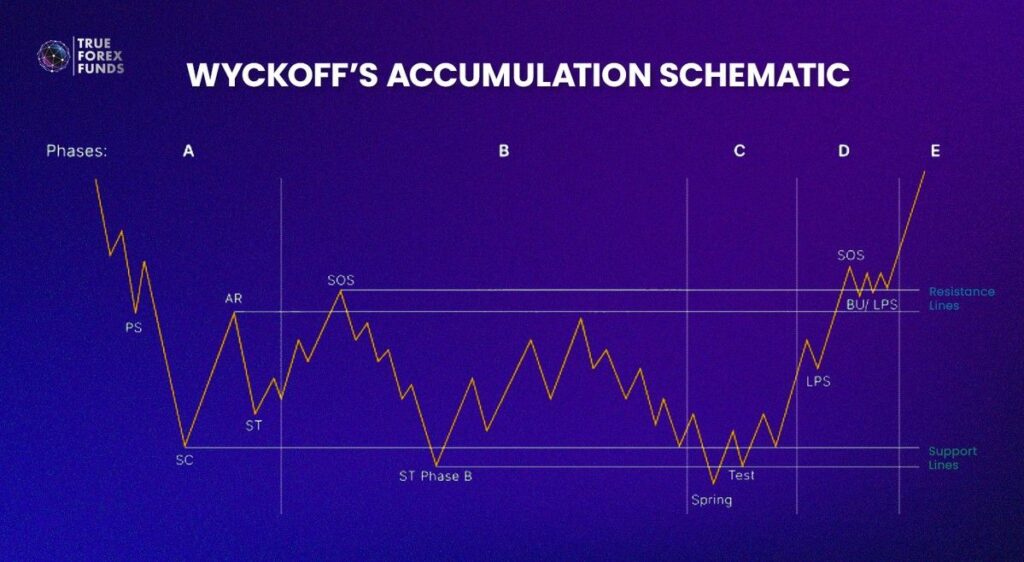
Phase A: The End of An Old Downtrend
Phase A of Wyckoff’s Accumulation marks the end of a downtrend and the initiation of the consolidation cycle. This phase encompasses four key events: Preliminary Support (PS), Selling Climax (SC), Automatic Rally (AR), and Secondary Test (ST).
- 1. Preliminary Support (PS): PS is the first event indicating the end of a bearish trend. It shows when big investors start buying and ending their bets that prices will fall. Volume increases, and spreads widen, signaling the potential conclusion of the downtrend. PS is a heads-up that there might be an accumulation cycle coming.
- 2. Selling Climax (SC): The SC follows the PS, presenting a price drop and significant volumes. Intense selling pressure is observed, mainly because they don’t know that big investors are starting to buy. SC makes prices fall quickly, and it sets an important support level for the accumulation phase.
- 3. Automatic Rally (AR): Once SC happens, supply and demand dynamics shift, causing the price to lower. AR is when the price goes higher, yet ideally does not surpass the swing high of the PS. The high of the AR becomes crucial because it is a key level that prices might struggle to go beyond.
- 4. Secondary Test (ST): The ST is the final event in Phase A. It involves a retest of the SC’s price level. Prices go back down to where SC happened, testing if the support is strong. Volume and the difference between buying and selling prices should be less than during SC. If ST breaks the low of SC, we might need to rethink our ideas before moving to Phase B.
After Phase A events, the downtrend concludes, and the market enters a consolidation phase with a defined trading range based on SC and AR levels. Although not actively participating, traders carefully analyze the market as it transitions into Phase B.
Phase B: The Start of New Uptrend
The second rule of Wyckoff is important in Phase B. It reflects that the longer big investors keep gathering assets and the more they collect, the bigger the upcoming increase in prices will likely be. Big investors (market makers) are buying a lot of assets at low prices while introducing selling pressure multiple times. It means that many Secondary Tests (STs) occur at this point.
Why do Many STs occur?
Secondary Tests (STs) are employed by big investors to create confusion, aiding them in manipulating the market, and these tests can even surpass the earlier Selling Climax. STs involve increased selling, causing buyers to lose confidence.
In the early stages of Phase B, there may be high volume and wider price swings. Once institutions absorb sufficient supply, Phase C of the accumulation cycle begins.
Phase C: Testing Phase
In Wyckoff’s Accumulation, Phase C is crucial. The price tests remaining supply for the upcoming markup, assessing support levels from Selling Climax (Phase A) and Second Test (Phase B). Notable events include:
- The Spring
- What happens: Prices drop but quickly bounce back within a certain range.
- Why it matters: Big investors can get both buy and sell positions, creating a subtantial benefits while retail investors might be trapped into selling when prices break a crucial level.
- The Shakeout:
- What happens: A more intense version of the Spring, with a bigger drop and potential higher trading volume.
- Why it matters: Regular traders might perceive it as clear bearish signals but big investors use this to absorb remaining supply. It often happens when big investors aren’t fully ready for the next phase and need more assets.
- Test
- What happens: Checking how well the Spring or Shakeout worked and if the previous support levels are still holding up.
- Why it matters: Occurs after big investors absorb remaining supply. There might be several tests before the next big move starts. Multiple Tests may take place before the markup initiates. However, if institutions fail to absorb enough supply, another Shakeout or Spring might occur. These tests help big investors figure out if the market is ready for the next big move.
Phase D: Sweet Spot to Confirm
In Phase D of Wyckoff’s Accumulation, the first signs of strength emerge after institutions have absorbed the supply. Following Phase C, demand is expected to surpass supply. Key indicators include:
- Sign of Strength (SOS):
- What it is: Think of SOS as the first clear indication that prices are about to go up.
- Why it matters: It confirms our earlier analysis by pushing prices toward the resistance levels we defined in Phases A and B. This move comes with a strong upward surge, wider price spreads, and increased trading activity.
- Last Point of Support (LPS):
- What it is: Following the SOS, the LPS often happens after the Spring and Test, and it might occur more than once.
- Why it matters: It’s like the market taking a breather, stepping back to a previous level of support (which used to be a resistance). Understanding the trading range and what happened in the previous phases is crucial here.
- Back Up (BU):
- What it is: Similar to the LPS but occurs after the SOS.
- Why it matters: It’s like a backup confirmation of the SOS. Another chance to get in on the action with lower risks and the potential for substantial rewards.
Phase D is a sweet spot for traders who correctly read the accumulation cycle. The SOS confirms our analysis, and the BU and LPS give us strategic entry points with minimal downsides and the possibility of handsome rewards.
Phase E: Final Stage of Accumulation
In this phase, demand takes the lead in determining prices, and even the general public starts embracing the bullish market sentiment. This phase ushers in a clear uptrend, characterized by robust bullish movements and minor retracements. Retail traders now observe the familiar trend patterns of higher highs and higher lows. While shakeouts can still happen, their impact is considerably less compared to the earlier accumulation phase.
Re-Accumulation
A Re-Accumulation happens when the market is on a long-term upswing and is likely to keep going up. In this phase, some buyers are selling their investments, and new sellers are entering the market.
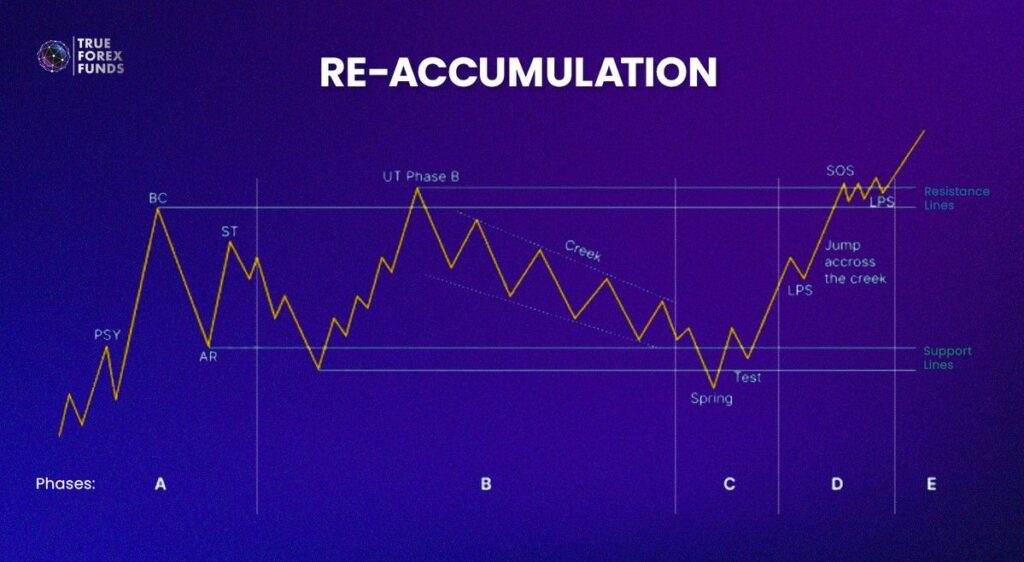
Market makers use these new selling positions to buy more. The steps and stages are similar, but the beginning of the re-accumulation is a bit different, similar to the start of a distribution cycle. Check out the Wyckoff distribution for more details on what happens during these events.
Wyckoff’s Schematics: A Proven Method
Wyckoff’s Schematics has been a proven method that works for both beginners and experienced traders, offering a straightforward and reliable way to make decisions. Yet to understand better, it is important to understand the theory behind it and gain experience through actual practice.
Unlock the power of Wyckoff’s Schematic and level up your trading skills!
Register with True Forex Funds today for a hands-on opportunity to practice and apply Wyckoff’s insights in a real trading environment.